Blog

  • Flutter vs React Native in 2026: Which Should You Build Your App With?

    Flutter vs React Native in 2026: Which Should You Build Your App With?

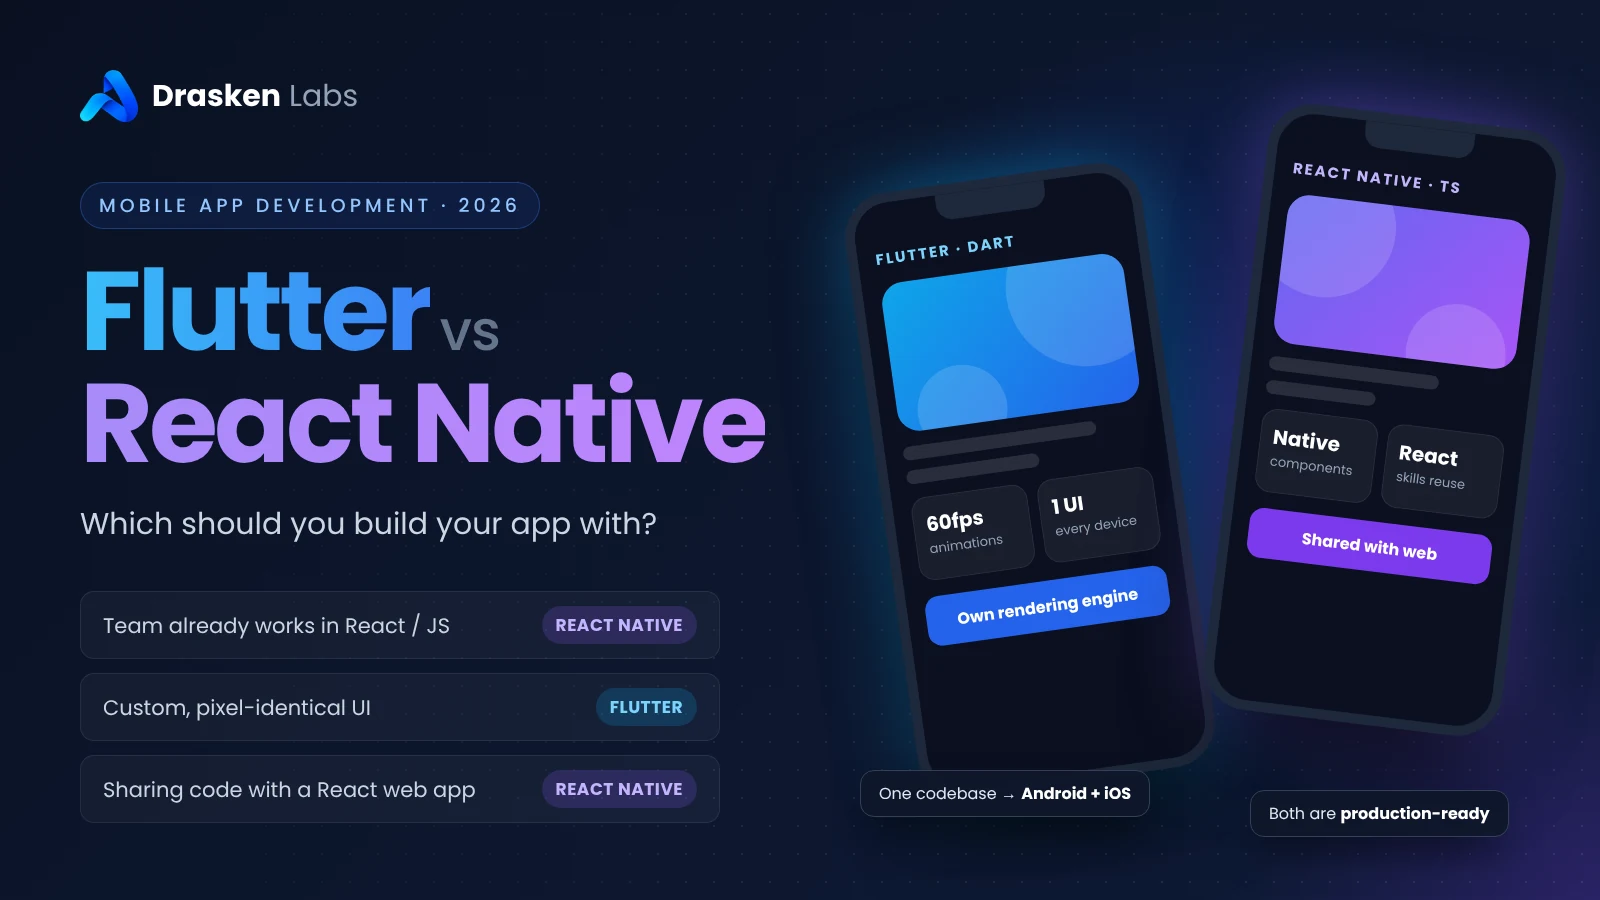
    Flutter vs React Native is one of the first decisions you make when planning a cross-platform app development project. Both are mature, production-ready ways to build one app for Android and iOS from a single codebase. In 2026 the short answer is this: choose React Native if your team already works in JavaScript or React, or you have a React web app to share code with. Choose Flutter if you want a highly custom, pixel-identical interface on every device and have no existing web stack to reuse.

    For most business apps, either framework will do the job well. The quality of the team building the app matters more than the framework it picks. This guide covers where the two genuinely differ, so you can make the choice for your product rather than by habit. If you are still at the budgeting stage, start with our breakdown of mobile app development cost in India.

    FlutterReact Native
    Backed byGoogleMeta
    LanguageDartJavaScript / TypeScript
    How the UI is drawnFlutter renders every pixel itselfUses the platform’s real native components
    Look across platformsIdentical on Android and iOS by defaultFollows each platform’s native look
    PerformanceVery consistent, strong for heavy animationNear-native for business apps since the New Architecture
    ToolingOne official toolchain and DevToolsExpo is the recommended framework and build service
    Hiring in IndiaGrowing pool of Dart/Flutter developersLarge pool of JavaScript and React developers
    Code sharing with webFlutter web works for apps, weak for SEO sitesShares logic and types with React web apps
    Over-the-air updatesThrough third-party toolsBuilt into Expo

    Flutter vs React Native: How Each Framework Works

    The biggest technical difference explains most of the others.

    Flutter draws its own interface

    Flutter apps are written in Dart. Instead of using the buttons, lists and text fields provided by Android and iOS, Flutter draws the entire interface itself with its own rendering engine, Impeller. Every widget looks and behaves the same on every device because Flutter controls every pixel.

    That gives designers complete freedom and removes a whole class of “looks different on Android” bugs. The trade-off is that Flutter has to recreate the look of native controls, and new platform UI conventions take time to be matched.

    React Native uses native components

    React Native apps are written in JavaScript or TypeScript using React. Your components map to the real native views on each platform, so a React Native list is an actual iOS or Android list.

    Older React Native versions talked to native code through a “bridge” that could become a bottleneck. The New Architecture, now the default and the only path in current releases, replaced it with direct communication between JavaScript and native code. That change closed most of the performance gap people still associate with React Native.

    Flutter vs React Native Performance

    For typical business apps, such as booking, e-commerce, field service, dashboards and customer portals, users will not notice a performance difference between a well-built Flutter app and a well-built React Native app. In practice, the Flutter vs React Native performance question only matters at the edges.

    Those edges look like this:

    • Flutter is more predictable for animation-heavy interfaces, custom charts and complex transitions, because it renders everything through one engine.
    • React Native performs well for standard interfaces and lists, and benefits automatically when Apple and Google improve their native components.
    • Both can be made slow by poor engineering: oversized images, unnecessary re-renders, and heavy work on the main thread.

    If your app is a game, uses augmented reality, processes video in real time or depends on intensive background work, consider fully native development instead of either framework.

    UI and Design Consistency

    This is often the deciding factor.

    Choose Flutter when your brand needs an identical, custom-designed experience across devices, including custom components that look nothing like standard platform controls. Designers’ mock-ups translate directly, and QA checks one appearance rather than two.

    Choose React Native when you want the app to feel native on each platform, with Android and iOS users each getting the controls and behaviours they are used to, or when you are extending a design system that already exists in React on the web.

    Developer Experience and Tooling

    Both frameworks offer hot reload, so developers see changes in seconds, and both have mature debugging tools.

    • Flutter ships as one official package: the SDK, command-line tools, testing framework and DevTools all come from Google and are versioned together. There are fewer decisions to make.
    • React Native is now built with Expo in most new projects. Expo adds a managed build service, easy access to device features, and over-the-air (OTA) updates that let you ship JavaScript fixes without waiting for app store review.

    OTA updates are a practical advantage for React Native. Flutter can do something similar through third-party tools, but it is not part of the standard setup. Either way, OTA updates are only for fixes and small changes; new native features still go through store review.

    Ecosystem and Access to Device Features

    Both ecosystems cover the features business apps need: camera, maps, location, push notifications, biometrics, payments, file uploads and analytics. Payment gateways commonly used in India, such as Razorpay, provide SDKs for both.

    • React Native draws on the npm ecosystem, which is huge but uneven. Some older libraries have not been updated for the New Architecture, so check maintenance status before depending on one.
    • Flutter packages come from pub.dev, which is smaller but more consistent, with many core plugins maintained by the Flutter team itself.

    When a feature has no package, both frameworks let developers write native Kotlin or Swift code and call it from the app. Budget for this if your app relies on unusual hardware or a vendor SDK that only ships for native platforms.

    Hiring and Team Fit

    For many businesses, this matters more than any technical point.

    India has a very large pool of JavaScript and React developers. A team that already builds React web apps can become productive in React Native quickly, and the same engineers can work across web and mobile. Flutter has become very popular in India too, and experienced Flutter developers are readily available, but Dart is a separate skill that your web team is unlikely to have.

    If you plan to keep development in-house, choose the framework your team can hire for and maintain. If you work with an external team, ask what they have shipped and maintained in production, not just what they list. Our comparison of freelancers and development companies covers what to check before handing over a project.

    Sharing Code with Your Web Product

    If you already have, or plan to have, a web application, this can settle the decision.

    • React Native shares a language, types and often business logic with a React web app: API clients, validation rules, state management and utility code. Teams building a web platform and a mobile app together get the most benefit.
    • Flutter web can run the same app in a browser, which works well for internal tools and app-like dashboards. It is a poor fit for marketing sites and content that needs to rank in search, which is better served by a proper website built for SEO.

    Long-Term Maintenance

    An app is maintained for years after launch, so upgrade effort matters.

    • React Native upgrades were historically painful. Expo has made them far more manageable, and with the move to the New Architecture complete, the platform is more stable than it has been for years.
    • Flutter upgrades are usually smoother because the whole toolchain is versioned together, although breaking changes in plugins still happen.
    • Both are backed by large companies that use them in their own products, and both have large production users worldwide. Neither is at meaningful risk of disappearing within the life of a typical business app.

    Whichever you choose, set up automated builds, crash reporting and regular dependency updates from the start. Apps that skip upgrades for two years end up needing a costly catch-up project. Crash and performance monitoring are part of good observability practice for the backend too.

    Flutter vs React Native for Startups and Growing Businesses

    If you are a founder or a business owner rather than a developer, the Flutter vs React Native question is really a question about speed, risk and who will look after the app in three years. A few practical points matter more than benchmark charts.

    Getting to a first version. Both frameworks let a small team ship an MVP to Android and iOS in the same time it would take to build one native app. The fastest choice is the one your team or vendor has already shipped in production, because they already know the build, release and app store steps that slow first projects down.

    Owning the code later. Whoever builds version one rarely maintains it forever. React Native is easier to hand over to an in-house team that already works in React, and the same developers can support your website and dashboards. Flutter code is very consistent between projects, so a new Flutter developer can usually find their way around a well-structured codebase quickly.

    Reducing risk. Neither framework is going away. Flutter is backed by Google, React Native by Meta, and both power large, well-known apps. The bigger risk is an app built without tests, documentation or a release process, whichever framework it uses.

    Before you decide, ask these questions of your team or development partner:

    • Which framework have you shipped and maintained in production, and can we see those apps?
    • Do we have a React web app, design system or team that we want to reuse?
    • How custom is our design, and how much animation does the product need?
    • How will we release urgent fixes, and do we need over-the-air updates?
    • Who will maintain the app after launch, and can we hire for that framework?

    Clear answers to these usually settle the React Native vs Flutter choice in one meeting. If you want a second opinion, our mobile app development team can review your requirements and recommend an approach before you commit to a build.

    Does the Framework Change the Cost?

    Not much. Build costs for a comparable app are similar in Flutter and React Native, because both let one team deliver Android and iOS from one codebase. That is what saves money compared with building two native apps. The larger cost differences come from scope, backend work, design and the team you hire, as we cover in our app development cost guide.

    Where framework choice does affect cost is reuse. A company with an existing React web app and team will usually spend less with React Native. A company starting from nothing with a design-led product may move faster with Flutter.

    Flutter vs React Native: Which Should You Choose?

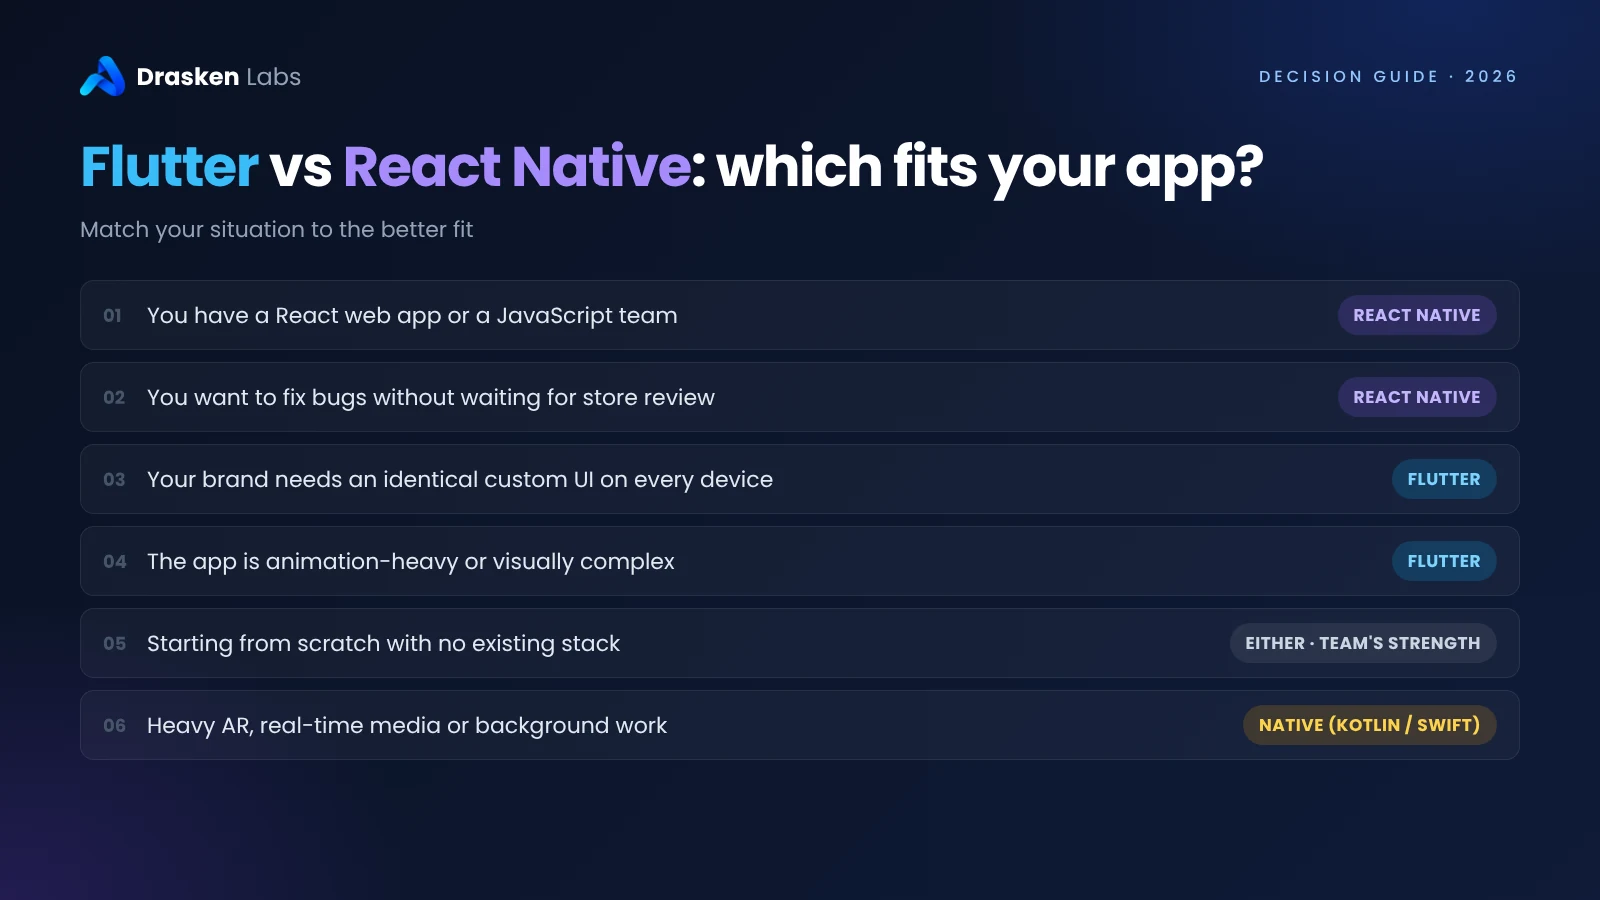
    Your situationBetter fit
    You have a React web app or a JavaScript teamReact Native
    You want to fix bugs quickly without waiting for store reviewReact Native
    Your brand needs an identical custom UI on every deviceFlutter
    The app is animation-heavy or visually complexFlutter
    You also need an internal web dashboard from the same codeFlutter (or React Native with a React web app)
    You are starting from scratch with no existing stackEither; choose based on your team or vendor’s strongest experience
    The app depends heavily on AR, real-time media or intensive background workNative (Kotlin and Swift)
    Flutter vs React Native decision guide: React Native for JavaScript teams and fast fixes, Flutter for custom UI and animation-heavy apps, native for AR and real-time media
    Flutter vs React Native decision guide: match your situation to the framework that fits it best.

    When to Choose Neither

    Cross-platform is the right default for most business apps, but not all of them:

    • Fully native (Kotlin for Android, Swift for iOS) when the product is built around deep platform features, demanding performance or the newest OS capabilities on day one.
    • A progressive web app (PWA) when users don’t need to find you in an app store and the browser can do everything the app needs.
    • Kotlin Multiplatform when you want native interfaces on each platform but shared business logic underneath, typically for teams already strong in Kotlin.

    Final Thoughts

    In the Flutter vs React Native debate, both are safe choices in 2026. React Native wins when you can reuse JavaScript skills, React code or a web team. Flutter wins when a custom, consistent interface is central to the product and you are not tied to an existing stack.

    Decide based on your team, your existing systems and your product’s design needs, and then invest in the things that matter more than the framework: a clear scope, a solid backend, testing, and a plan for maintenance.

    Whichever side of the Flutter vs React Native choice you land on, budget for the work that comes after launch: OS updates every year, framework upgrades, dependency checks, crash monitoring and small improvements based on what users actually do. A well-maintained app in either framework will serve your business far better than a neglected one built with the “right” tool.

    Not sure which framework fits your app?

    We build with both Flutter and React Native, and we recommend native or web when those fit better. Tell us about your product and the Drasken Labs team can help you choose the approach and scope the build. See our mobile app development services.

    Discuss your app with Drasken Labs →

    Is Flutter or React Native better in 2026?

    Neither is better for every app. React Native is usually the better choice when you have a JavaScript or React team or a React web app to share code with. Flutter is usually better when you need a highly custom, identical interface on Android and iOS and have no existing web stack.

    Is Flutter faster than React Native?

    For most business apps, users will not notice a difference. Flutter is more predictable for animation-heavy and visually complex interfaces, while React Native’s New Architecture has closed most of the older performance gap for standard apps.

    Which is easier to hire for in India, Flutter or React Native?

    React Native, in most cases, because India has a very large pool of JavaScript and React developers who can move into React Native quickly. Experienced Flutter developers are also widely available, but Dart is a separate skill.

    Does Flutter or React Native cost less to build an app?

    Build costs are similar for a comparable app because both deliver Android and iOS from one codebase. React Native can cost less if you can reuse an existing React web codebase or team.

    Can I use the same code for my website?

    With React Native, you can share business logic and types with a React web app. Flutter can run the same app on the web, which suits internal tools and dashboards, but it is not a good fit for marketing websites that need to rank in search engines.

    When should I build a native app instead?

    Choose native Kotlin and Swift development when your app depends on deep platform features, augmented reality, real-time media processing, intensive background work or the newest OS features as soon as they are released.
  • Build vs Buy Software: A Decision Framework for Growing Businesses

    Build vs Buy Software: A Decision Framework for Growing Businesses

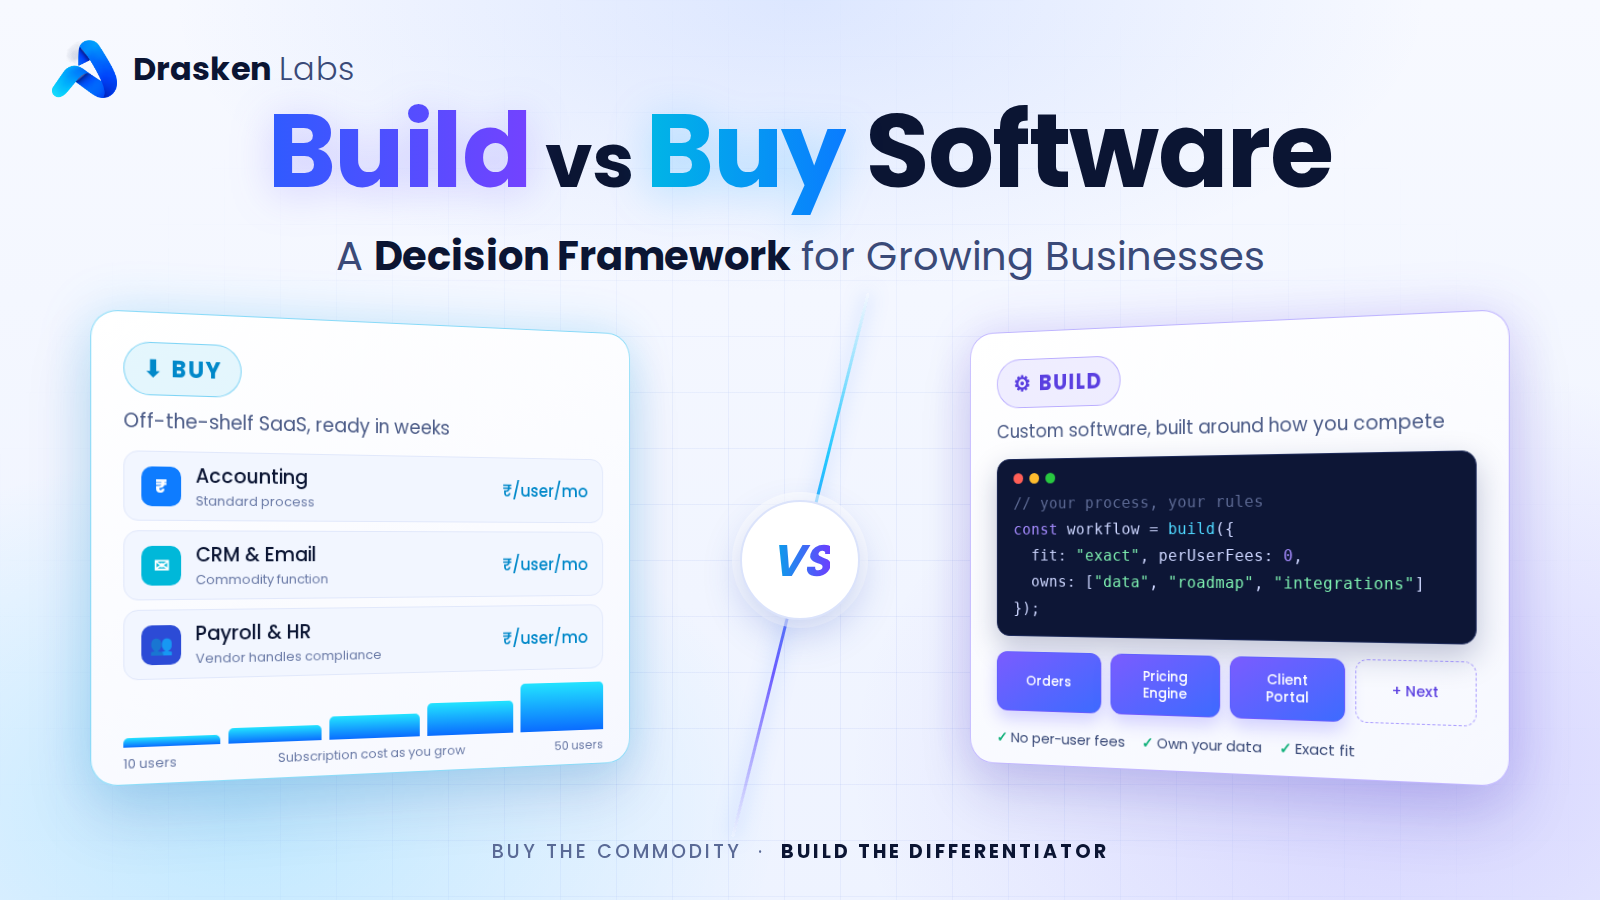
    For a growing business, the build vs buy software decision comes down to one question: does this software support how you compete, or how you operate? Buy off-the-shelf software for standard functions every business needs, such as accounting, payroll, email and basic CRM. Build custom software when the process is what makes you different, when off-the-shelf tools force you into costly workarounds, or when subscription costs across users and tools start exceeding what it would cost to own the system.

    Most businesses end up with a mix: bought software for commodity functions, and custom software for the workflows and integrations that are specific to them. This guide gives you a framework to decide which is which, including the costs most comparisons leave out.

    Build vs Buy Software: The Short Version

    Buy when…Build when…
    The process is standard across businesses (accounting, payroll, email)The process is how you win customers or deliver your service
    A mature product does 80% or more of what you needEvery tool you try needs heavy workarounds or several products stitched together
    You need it working in weeksYou can invest months for a long-term advantage
    You have few users and simple needsPer-user subscriptions across a growing team are getting expensive
    Compliance and updates are handled better by a specialist vendorYou need control over data, integrations, roadmap or where the data lives

    The Real Cost of Buying

    Off-the-shelf software looks cheap because the price is on the website. The full cost includes much more:

    • Subscriptions that scale with you. Per-user pricing is fine for five people and painful for fifty. Add-ons, higher tiers and usage limits push it further.
    • Workarounds. Spreadsheets, manual re-entry and staff time spent bridging gaps between what the tool does and what you need.
    • Integration costs. Connecting several products usually needs connector tools, middleware or developer time anyway.
    • Switching costs. Your data, processes and training are tied to the vendor. Leaving later is often expensive.
    • Price and product changes. The vendor controls pricing, features and roadmap, and can change any of them.

    The Real Cost of Building

    Custom software has a larger upfront cost and a longer timeline. It also carries ongoing costs that must be planned for:

    • Initial development, from discovery and design to development, testing and launch
    • Hosting and infrastructure, which you pay for directly
    • Maintenance, typically 15–25% of the build cost each year for updates, security patches and fixes
    • Ongoing improvements as your business changes
    • Dependence on your development team, which makes documentation, code ownership and a good partner essential

    In return you get software that fits your process exactly, no per-user fees, and full control over data, integrations and roadmap. Our guide to custom software development services explains what a typical engagement includes.

    A Five-Question Build vs Buy Decision Framework

    1. Is this process a differentiator or a commodity?

    If a customer would never notice or care how you do it, as with payroll or bookkeeping, buy. If it shapes the customer experience, your speed, your pricing or your delivery, building may give you an advantage competitors cannot buy. Martin Fowler describes this as the utility vs strategic dichotomy.

    2. How well does the best available product fit?

    Test the leading options against your real workflows, not their demos. If the best fit covers most of what you need with configuration, buy. If you need three products plus spreadsheets to cover one process, that is a signal to build.

    3. What is the five-year total cost?

    Work out the total cost of ownership of each option over five years. Compare subscriptions for your projected team size, plus integration and workaround costs, against build cost plus hosting and maintenance. For many growing businesses, custom software becomes cheaper somewhere between year two and year four, while bought software stays cheaper for small teams with standard needs.

    4. How important is control?

    Consider data ownership and location, the ability to integrate with any system, and freedom from a vendor’s pricing and product decisions. Regulated industries and businesses with sensitive data often weigh this heavily.

    5. Can you support what you build?

    Custom software needs a team to maintain it, in-house or with a development partner. If you cannot commit to that, buy, or build something much smaller.

    A Worked Example: Five-Year Cost

    A 40-person service business compares a field-service SaaS product with a custom system:

    Buy (SaaS)Build (custom)
    Upfront₹1 lakh setup and data migration₹18 lakh build
    Yearly licences or hosting₹2,500 per user per month = ₹12 lakh a year₹1.5 lakh hosting a year
    Yearly integrations and workarounds₹3 lakhIncluded in the build
    Yearly maintenanceIncluded in subscription₹3.6 lakh (20% of build)
    Five-year totalAbout ₹76 lakhAbout ₹44 lakh

    With 10 users instead of 40, the SaaS cost falls to about ₹31 lakh over five years and buying wins. The numbers are illustrative; the point is to run them for your own team size, growth and requirements.

    The Hybrid Approach Most Businesses Should Take

    Build versus buy is rarely all or nothing. The most cost-effective setups usually:

    • Buy standard software for accounting, payroll, email, documents and communication
    • Build the core workflows that differentiate the business
    • Build integrations that connect bought tools so data flows without manual work
    • Add targeted automation to remove repetitive steps between systems

    Integration and automation often deliver most of the value of a custom system at a fraction of the cost, and our AI and automation team builds it.

    The same logic applies to infrastructure. Running WhatsApp messaging at scale, for example, is something most businesses should buy as a platform, such as WA Console, while building the business logic that decides what to send and when.

    Warning Signs You Made the Wrong Choice

    Signs you should have built:

    • Staff spend hours a week copying data between tools
    • You have changed your process to fit the software rather than the other way round
    • Subscription costs rise faster than revenue
    • You cannot get the reports or integrations you need at any price tier

    Signs you should have bought:

    • Your team is maintaining custom software for a standard function like invoicing or HR
    • The custom system is years behind comparable products and nobody has time to improve it
    • Only one developer understands how it works

    If You Decide to Build

    • Start with the core workflow, not every feature. Launch, use it, then extend it.
    • Own everything: source code, cloud accounts, domains and data.
    • Choose the right contract model. Fixed price suits a tightly defined first version, while time and material suits products that will evolve.
    • Plan for maintenance from day one in both budget and team.
    • Pick a partner, not just a coder. Our comparison of freelancers and development companies covers what to check.

    Final Thoughts on Build vs Buy Software

    Buy software for what every business does. Build software for what makes your business different, or when bought tools cost more in subscriptions and workarounds than owning the system would. Run a five-year cost comparison for your own numbers, and consider a hybrid of bought tools, custom core workflows and integrations before committing to either extreme.

    Weighing a custom build against off-the-shelf software?

    The Drasken Labs team can review your workflows and tools, estimate the five-year cost of each option, and recommend what to buy, what to build and what to integrate. See our custom software development services.

    Discuss build vs buy with Drasken Labs →

    Should I build or buy software for my business?

    Buy off-the-shelf software for standard functions such as accounting, payroll and email. Build custom software when the process differentiates your business, when available tools need heavy workarounds, or when subscription costs across your team exceed the cost of owning a system.

    Is custom software cheaper than SaaS in the long run?

    It can be. For larger or growing teams, per-user subscriptions plus integration and workaround costs often exceed the cost of building and maintaining custom software within two to four years. For small teams with standard needs, SaaS usually stays cheaper.

    What are the hidden costs of off-the-shelf software?

    Per-user pricing that grows with your team, add-ons and higher tiers, staff time spent on workarounds, integration tools and development, and the cost of switching vendors later.

    What are the ongoing costs of custom software?

    Hosting and infrastructure, plus maintenance of roughly 15–25% of the build cost each year for updates, security patches and fixes, and budget for new features as the business changes.

    Can I combine custom and off-the-shelf software?

    Yes, and most businesses should. A common approach is to buy standard tools, build the core workflows that differentiate you, and build integrations so data flows between them automatically.

  • SLOs for Small Teams: Error Budgets Without an SRE Department

    SLOs for Small Teams: Error Budgets Without an SRE Department

    SLOs for small teams have a reputation problem: they look like something only Google can afford to run. They aren’t.

    Ask most teams what their reliability target is and you get “99.9% uptime.” Ask what that measures, and the conversation gets vague. Uptime of what? Measured from where? Does a page that loads in twelve seconds count as up?

    That vagueness is why the number never changes any decision. A reliability target that doesn’t tell you what to work on next week isn’t a target, it’s a slogan.

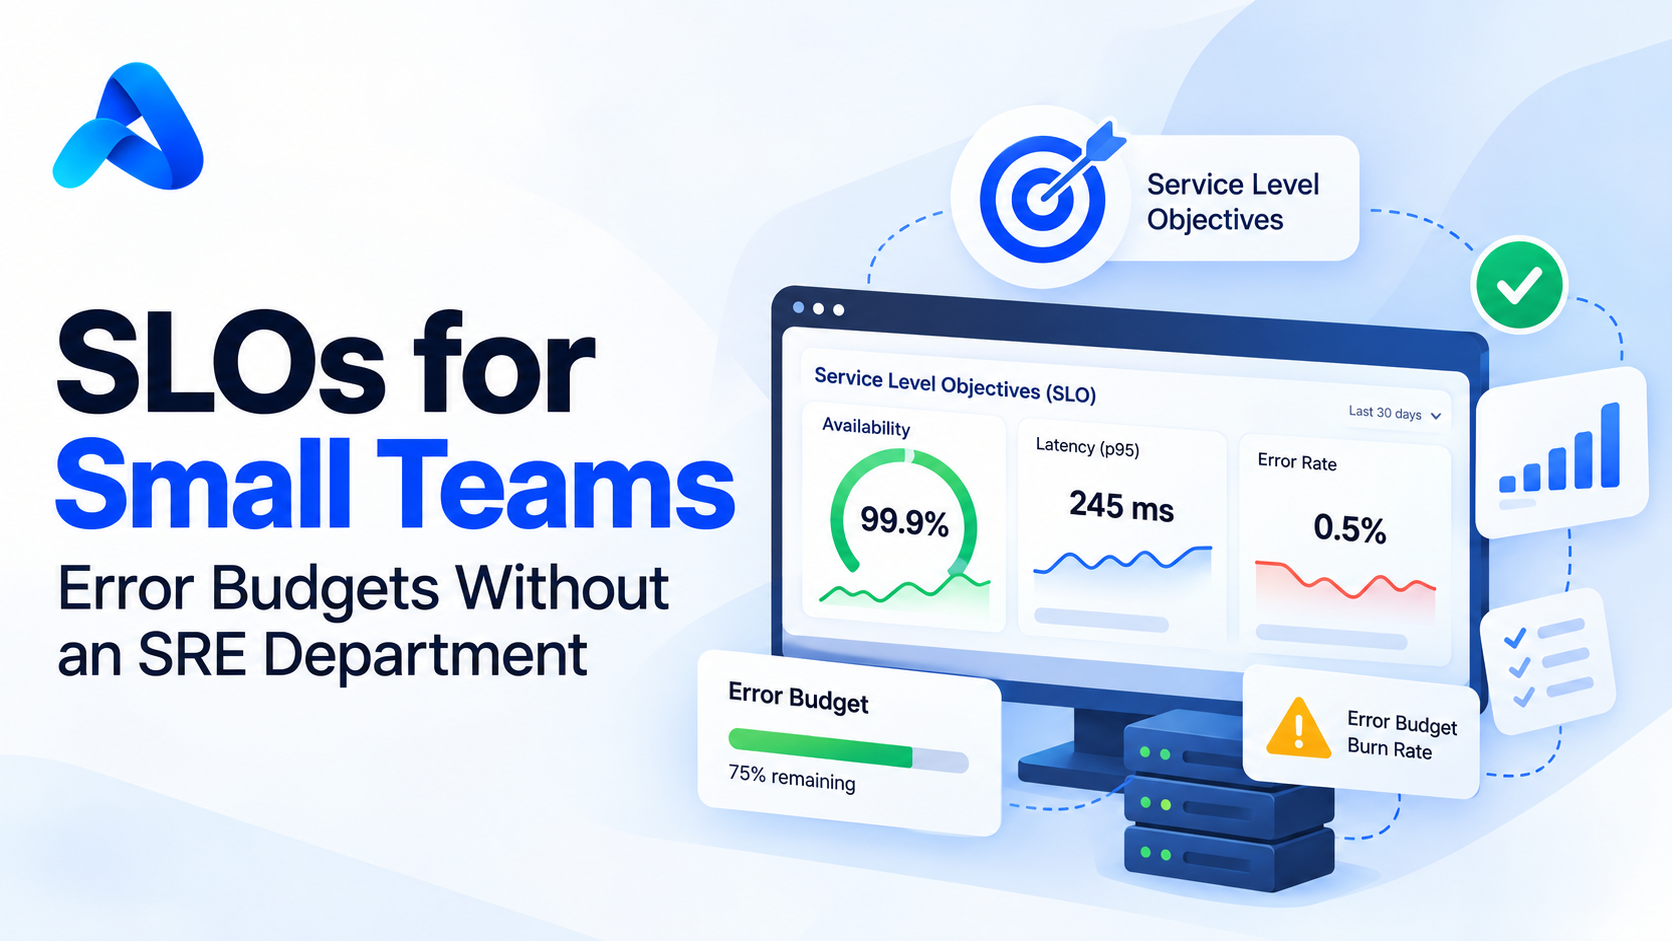
    Service Level Objectives fix this, and the usual objection is that SLOs are a Google thing requiring a dedicated SRE organisation. They aren’t. A four-person team can run meaningful SLOs on two metrics per service. Here’s how small teams can set SLOs, spend an error budget and alert on burn rate, without the ceremony.

    The three terms, quickly

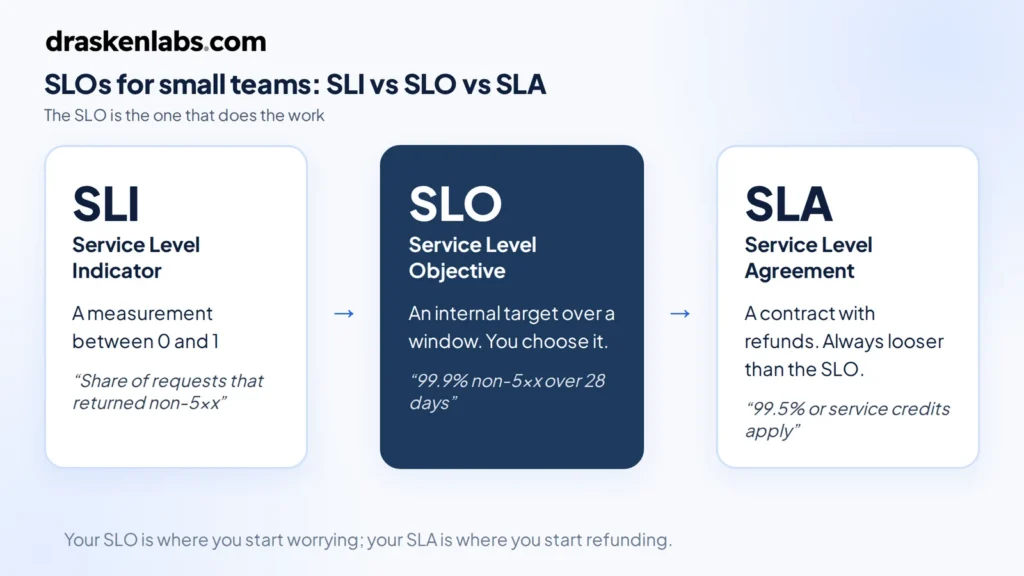
    SLI — Service Level Indicator. A measurement. “The proportion of HTTP requests that returned a non-5xx status.” A number between 0 and 1.

    SLO — Service Level Objective. A target for that measurement over a window. “99.9% of requests return non-5xx, measured over 28 days.” Internal. You choose it.

    SLA — Service Level Agreement. A contractual promise to a customer, with financial consequences. Set it looser than your SLO, always. Your SLO is the line where you start worrying; your SLA is the line where you start refunding. If they’re the same number, you find out about problems from your customers’ lawyers.

    The one that does the work is the SLO.

    SLOs for small teams: how an SLI, an SLO and an SLA differ
    How SLOs relate to SLIs and SLAs.

    The error budget is the whole point

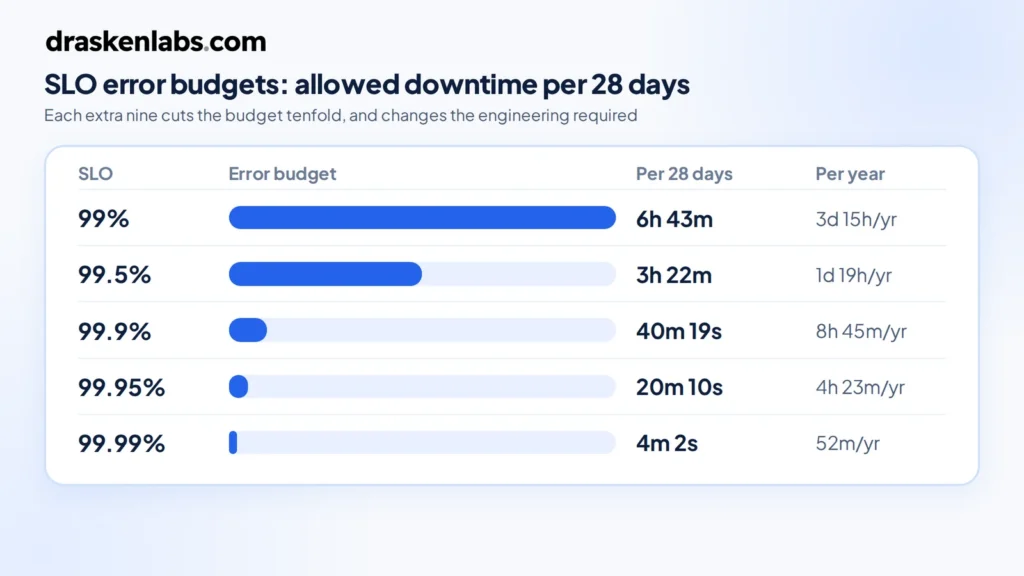
    If your SLO is 99.9% over 28 days, you are explicitly saying that 0.1% failure is acceptable. That 0.1% is your error budget, and turning it into time makes it concrete:

    SLODowntime per 28 daysPer year
    99%6h 43m3d 15h
    99.5%3h 22m1d 19h
    99.9%40m 19s8h 45m
    99.95%20m 10s4h 23m
    99.99%4m 2s52m

    Look at 99.99% for a moment. Four minutes a month. That is less time than it takes a human to read a page, open a laptop, and log in. Hitting four nines means automated failover with no human in the loop, multi-region redundancy, and deployment practices that make bad releases nearly impossible. It is a different engineering budget entirely, not a slightly better version of three nines.

    This is the first thing an error budget does for you: it makes reliability targets cost something, so they stop being chosen by whoever wants to sound most ambitious in the meeting.

    The second thing is that it reframes reliability work as a resource rather than a virtue. You have not “failed” if you consumed 60% of your budget. You have used a resource you were allocated, buying deployment velocity with it. Budget remaining means ship faster. Budget exhausted means stop and fix. That’s a decision rule, which is more than “we value reliability” ever gave you.

    SLOs and error budgets: allowed downtime per 28 days for 99% to 99.99% targets
    Error budgets for common SLOs over a 28-day window.

    Choosing SLIs that mean something

    Two rules cover most of it.

    Measure what the user experiences, not what the server reports. CPU utilisation is not an SLI. Neither is memory, disk, or pod restart count. Those are diagnostics — useful once something is wrong, useless as a definition of “wrong.” A service can be at 95% CPU and perfectly healthy, or at 5% CPU and completely broken.

    Never use averages for latency. Average response time is the single most misleading metric in production. If 95% of requests take 50ms and 5% take 30 seconds, your average looks acceptable and one in twenty of your users is furious. Use a threshold instead: the proportion of requests completing under 500ms. Now it’s a ratio, it composes with your availability SLI, and it can’t hide a tail.

    For most request-serving services, two SLIs is the right number:

    • Availability: successful requests ÷ valid requests
    • Latency: requests under threshold ÷ valid requests

    “Valid requests” matters. Exclude 4xx client errors from availability — a user sending a malformed request is not your service failing. Exclude health checks and synthetic traffic, or you’ll dilute your own signal with things no user ever touches.

    For non-request workloads, adapt the shape rather than the concept. Data pipelines: freshness, “the proportion of hours where output was less than 15 minutes stale.” Queue consumers: “the proportion of messages processed within 30 seconds of enqueue.” Batch jobs: completion within the expected window.

    Setting the target: measure first, then decide

    The most common failure is picking a target aspirationally. Someone says 99.9%, everyone nods, and three weeks later you’re missing it constantly, alerts are firing, and the team has learned to ignore them.

    Do it the other way round. Instrument the SLI, collect four weeks of data, and look at what you actually deliver. If you’re currently at 99.5%, set the SLO at 99.5%. Not 99.9%.

    That feels like cheating. It isn’t. The job of SLOs is to tell you when something has changed for the worse. A target you meet 99% of the time does that. A target you miss constantly tells you nothing except that you set it badly, and it trains your team to ignore the signal — which is a genuinely expensive thing to teach people.

    Once you’re comfortably meeting it, tighten it. Reliability targets should ratchet.

    The other half of the question is what your users actually need. A B2B tool used during Indian business hours has a different profile than a payments API. If your customers barely notice a two-minute blip, three nines may be more than they’re paying for, and the engineering effort is better spent elsewhere. Reliability beyond what users perceive is money you have set on fire.

    Burn rate alerting, not threshold alerting

    This is where SLOs stop being documentation and start improving your on-call.

    The naive approach is to alert when one of your SLOs is breached. Too late — you’ve already spent the budget. The slightly-less-naive approach is to alert on any error rate above zero, which pages you at 3am for a blip that consumed four seconds of a forty-minute budget.

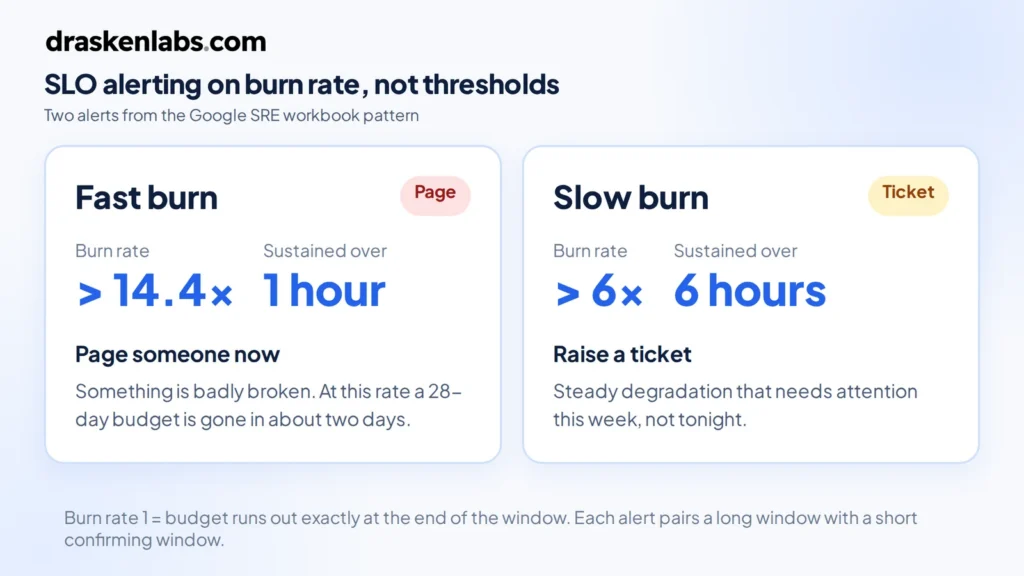
    Burn rate solves this. Burn rate is how fast you’re consuming the error budget relative to the rate that would exhaust it exactly at the end of the window. Burn rate 1 means you’ll finish the month right on target. Burn rate 14.4 means you’ll exhaust a 28-day budget in about two days.

    The standard pattern, from the Google SRE workbook, uses two alerts:

    • Fast burn: burn rate above 14.4 sustained over 1 hour → page someone. Something is badly broken right now.
    • Slow burn: burn rate above 6 sustained over 6 hours → raise a ticket, don’t page. Something is degrading steadily and needs attention this week, not tonight.

    Each alert uses two windows — a long one for signal and a short one to confirm the problem is still happening — so alerts resolve when the incident does rather than lingering.

    The practical effect is that your pager fires on user-visible harm, proportional to severity. A brief spike that costs you thirty seconds of budget doesn’t wake anyone. A sustained failure does, immediately. Most teams we work with cut their page volume by more than half in the first month after switching, which does more for reliability than any dashboard, because a team that trusts its pager investigates instead of dismissing.

    SLO burn-rate alerting: fast burn above 14.4x over 1 hour pages, slow burn above 6x over 6 hours raises a ticket
    Burn-rate alerting for SLOs: fast burn pages someone, slow burn raises a ticket.

    The error budget policy

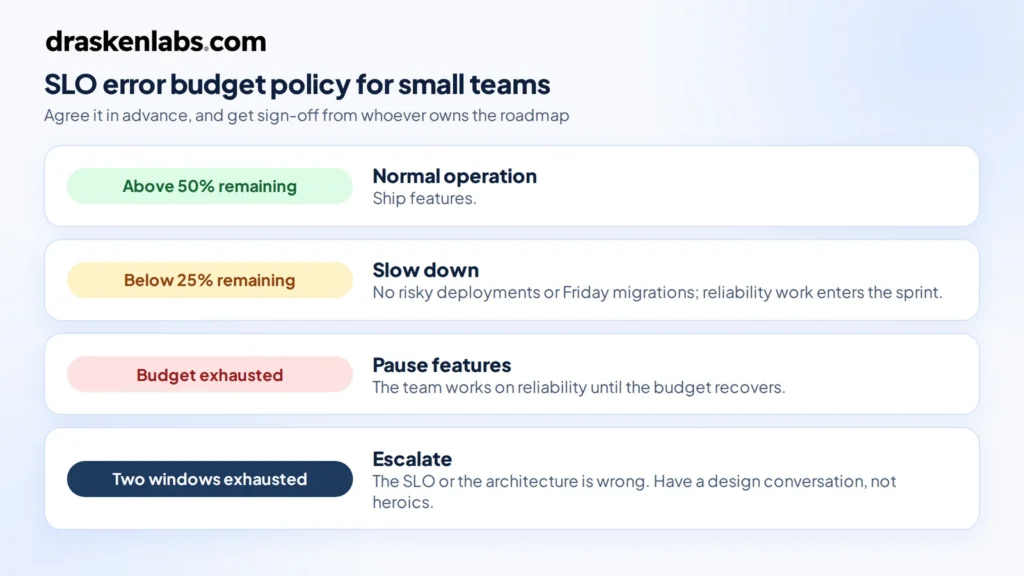
    An error budget without an agreed consequence is a chart nobody looks at. Write down, before you need it, what happens at each threshold. One page is enough:

    • Budget above 50% remaining: normal operation. Ship features.
    • Below 25%: no risky deployments. No schema migrations on Friday. Reliability items get pulled into the sprint.
    • Exhausted: feature work pauses. The team works on reliability until the budget recovers.
    • Two consecutive windows exhausted: the SLO was wrong or the architecture is inadequate. Escalate to a design conversation, not more heroics.

    The value here is that it’s agreed in advance, in calm conditions. Arguing about whether to pause the roadmap during an outage is a bad time to first discover that engineering and product have different views.

    Get explicit sign-off from whoever owns the roadmap. An error budget policy that engineering wrote alone is a policy that gets overruled the first time it’s inconvenient.

    SLO error budget policy thresholds: normal operation, slow down, pause features, escalate
    An error budget policy agreed before SLOs are breached.

    Where teams go wrong

    Too many SLOs. Every service, four indicators each, thirty dashboards nobody reads. Start with your two or three most important user-facing services and one or two SLIs each. That is enough to change behaviour, which is the only test that matters.

    SLOs on internal services. If a user never touches it directly, its reliability matters only through its effect on something they do touch. Measure the user-facing thing. Internal service health is a diagnostic.

    A 100% target. Not achievable, and it destroys the mechanism. Zero error budget means every deploy is a violation, so the concept gets abandoned within a month.

    Never revisiting them. Traffic patterns change, architectures change, user expectations change. Review targets quarterly.

    Tracking without acting. The most common outcome by far. A beautiful Grafana dashboard, burn-rate alerts wired up, and no agreed consequence when the budget goes. It becomes decoration. The policy is not the boring part of SLOs, it’s the entire point.

    Making SLOs work for small teams in practice

    You don’t need a platform team. On a Prometheus and Grafana stack: recording rules to compute the SLI ratios, multi-window burn-rate alerts in Alertmanager, one Grafana panel per SLO showing budget remaining. Sloth generates the rules from a short YAML spec if you’d rather not hand-write them, and OpenSLO gives you a vendor-neutral format if you expect to move backends. Datadog, Grafana Cloud, and Honeycomb all have native support for SLOs if you’re already paying for one.

    The instrumentation matters more than the tooling. Your SLIs are only as good as the data underneath them, which is a question of how you’ve instrumented your services and how much of that data you can afford to keep — the cardinality problem that quietly determines what your observability stack costs.

    We took one healthtech client from no coverage across 200+ microservices to full instrumentation with SLOs and burn-rate alerting in under two weeks, cutting mean time to detect below two minutes. The instrumentation was the fast part. Agreeing what “good” meant for each service took longer, and mattered more.

    If your alerts fire constantly and nobody trusts them, that’s usually an SLO problem wearing a monitoring costume. Tell us what you’re running and we’ll take a look — it’s the core of our observability work.

    Sources and further reading

  • Core Web Vitals for Business Websites: What They Measure, What Breaks Them, and What to Fix First

    Core Web Vitals for Business Websites: What They Measure, What Breaks Them, and What to Fix First

    Core Web Vitals for business websites come down to one question: does the page let a visitor become an enquiry without friction? A business website has one job that matters more than the rest: turning a visitor into an enquiry. Everything that slows that down, a hero image that takes four seconds to appear, a form that freezes when someone taps it, a button that jumps just as they go to click it, costs you leads before anyone reads a word of your copy.

    Google has a way of measuring exactly those three failures. They are a ranking signal, but for most businesses the bigger cost of failing them isn’t the ranking. It’s the visitor you paid to bring in who leaves before the page is usable.

    This guide explains what the three metrics measure in 2026, what typically breaks them on business websites, and the order we fix them in when we take over a slow site.

    Quick answer: To pass Core Web Vitals in 2026, a page needs Largest Contentful Paint (LCP) at or under 2.5 seconds, Interaction to Next Paint (INP) at or under 200 milliseconds, and Cumulative Layout Shift (CLS) at or under 0.1, measured at the 75th percentile of real Chrome visitors over a rolling 28-day window. Mobile and desktop are assessed separately.

    What are Core Web Vitals?

    Core Web Vitals are three field metrics that describe how a page feels to a real person: how quickly the main content appears, how quickly the page reacts to input, and whether the layout stays still while it loads.

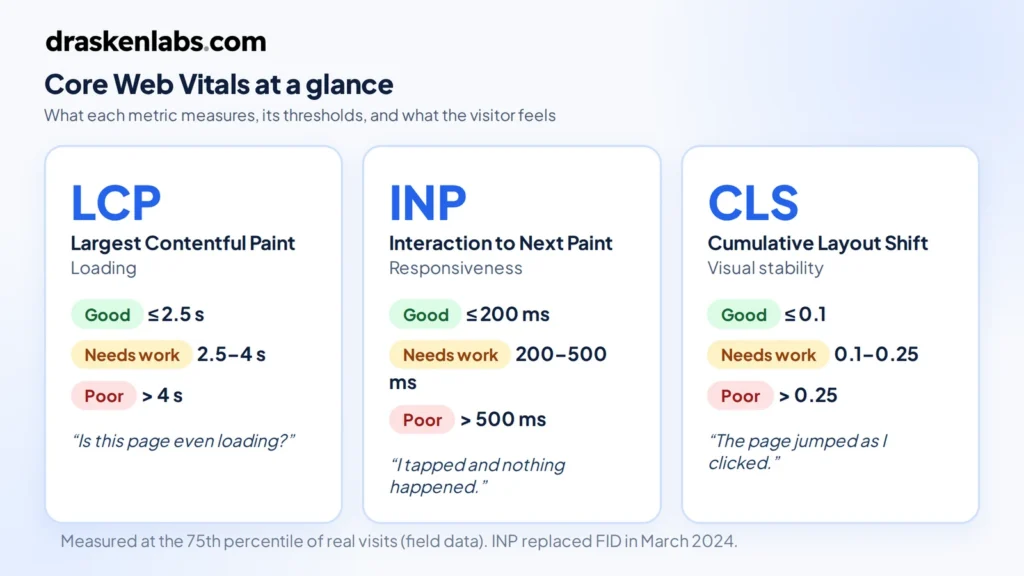
    MetricWhat it measuresGoodNeeds improvementPoorWhat the visitor experiences
    LCP (Largest Contentful Paint)Loading: when the largest visible element, usually the hero image or headline, finishes rendering≤ 2.5 s2.5–4 s> 4 s“Is this page even loading?”
    INP (Interaction to Next Paint)Responsiveness: the delay between a tap, click or keypress and the next visual update, across the whole visit≤ 200 ms200–500 ms> 500 ms“I tapped the button and nothing happened.”
    CLS (Cumulative Layout Shift)Visual stability: how much content moves unexpectedly while the page loads≤ 0.10.1–0.25> 0.25“I clicked the wrong thing because the page jumped.”

    INP replaced First Input Delay (FID) as the responsiveness metric in March 2024. That change matters for business sites: FID only measured the first interaction, so a site could pass while its enquiry form, menu or filter felt sluggish. INP looks at interactions across the whole visit, which is why many sites that were “green” in 2023 started failing.

    The thresholds themselves have been stable since then. What changed recently is reach: LCP and INP are now measurable in all major browsers, not just Chrome, so the same numbers you see in Google’s tools can be collected from your Safari and Firefox visitors too.

    Core Web Vitals thresholds: LCP 2.5 s, INP 200 ms and CLS 0.1, with what each problem feels like to a visitor
    The three metrics, their thresholds, and what a visitor experiences when each one fails.

    Why Core Web Vitals matter for a business website

    Rankings: a tiebreaker, not a shortcut

    These metrics are part of Google’s page experience signals. Be realistic about their weight: relevance and content quality still decide most rankings. Where they matter is when your service page and a competitor’s are otherwise close. In local and B2B service searches, that’s common, because most pages targeting “website development company in Delhi” or “cloud consultant Dubai” say roughly the same thing.

    Conversions: where the real money is

    Speed and stability affect whether people act. The best-documented example is Vodafone Italy’s A/B test, published on web.dev, where improving LCP by 31% on otherwise identical landing pages produced 8% more sales. For a business website, the equivalent is enquiries, calls and booked consultations.

    Paid traffic: you pay for every bounce

    If you run Google or Meta ads to a landing page, every visitor who leaves before the page renders is a click you paid for and got nothing from. Slow landing pages quietly inflate your cost per lead.

    Your 75th-percentile visitor is not on your laptop

    Google grades you on the experience of the slower end of your real audience. For businesses selling into India, the UAE or Southeast Asia, that visitor is often on a mid-range Android phone on a mobile network. A page that feels instant on office Wi-Fi can still fail.

    Field data vs lab data: the mistake most businesses make

    The most common conversation we have goes like this: “Our developer showed us a Lighthouse score of 95, but Search Console says our pages are failing.” Both can be true.

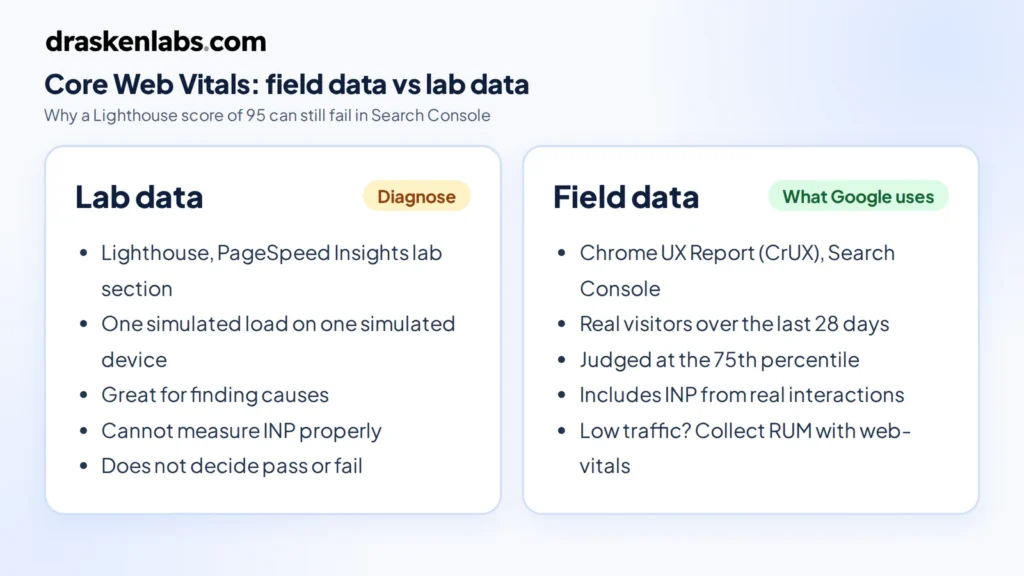
    • Lab data (Lighthouse, the lab section of PageSpeed Insights) is a single simulated page load on a simulated device. It’s excellent for diagnosing problems and cannot tell you whether you pass.
    • Field data (the Chrome User Experience Report, shown in Search Console and at the top of PageSpeed Insights) is what real visitors experienced over the last 28 days. This is what Google uses.

    Lab tests also can’t measure INP properly, because INP depends on real people clicking real things. A perfect lab score with a heavy chat widget that only loads after interaction will still fail in the field.

    If your site doesn’t get enough traffic to have field data in Search Console, you have two options: use lab tests as a proxy, or collect your own real-user monitoring (RUM) data with the open-source web-vitals library. If you send RUM data into your own metrics stack, tag it by page template (home, service, blog post) rather than by full URL. Per-URL labels are one of the fastest ways to blow up your observability bill with high-cardinality metrics. Setting this up properly is part of what our observability service covers.

    Core Web Vitals field data vs lab data: Lighthouse diagnoses problems, CrUX field data decides pass or fail
    Lab data finds the cause; field data decides whether you pass.

    How to check your own site in five minutes

    1. Open PageSpeed Insights, paste your homepage URL and run the test.
    2. Read the top section first, “Discover what your real users are experiencing”. That is field data. If it says “Passed” for mobile, your homepage passes; the Lighthouse score underneath is only a diagnostic.
    3. Switch between the Mobile and Desktop tabs. Mobile is where most business sites fail.
    4. Repeat for one service page and your main landing page, since those templates usually differ from the homepage.
    5. In Search Console, open Experience → Core Web Vitals to see which groups of URLs are failing and on which metric.

    That gives you a clear, evidence-based picture of where you stand before you spend anything on fixes, and a baseline to compare against once changes go live.

    What usually breaks Core Web Vitals on business websites

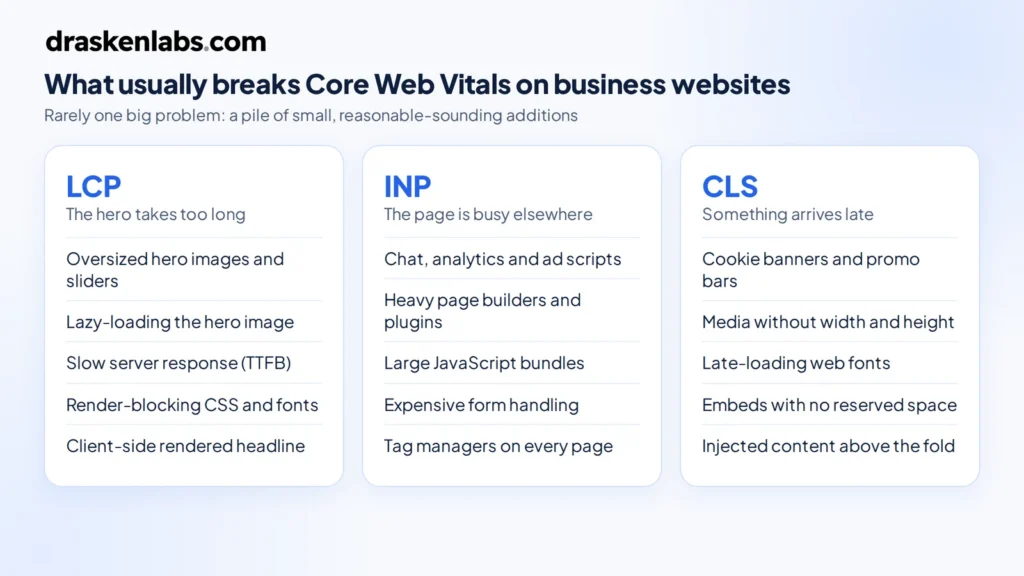
    After auditing a lot of company sites, the causes are remarkably consistent. It’s rarely one big problem; it’s a pile of small, reasonable-sounding additions.

    What breaks Core Web Vitals on business websites: causes of poor LCP, INP and CLS
    The most common causes of poor LCP, INP and CLS on business websites.

    LCP problems: the hero takes too long

    • Oversized hero images or sliders. A 3 MB banner exported straight from a design tool, or a five-slide carousel where every slide loads upfront.
    • Lazy-loading the hero. Lazy loading is right for images below the fold and wrong for the one image that defines LCP.
    • Slow server response. Shared hosting, no page caching, or a CMS that builds every page on every request pushes Time to First Byte up, and LCP can’t start until the HTML arrives.
    • Render-blocking CSS and fonts. Several font families, each in multiple weights, loaded before anything can paint.
    • Client-side rendering of the hero. If the headline only appears after a JavaScript bundle downloads and runs, LCP waits for all of it.

    INP problems: the page is busy doing something else

    • Third-party scripts. Chat widgets, analytics, ad pixels, heatmaps, A/B testing tools and tag managers all compete for the same main thread your visitor’s tap needs.
    • Heavy page builders and plugin stacks. Each plugin adds its own JavaScript, often on every page whether it’s used or not.
    • Large JavaScript bundles. Especially on sites that ship an entire app framework to render what is mostly static marketing content.
    • Expensive form handling. Validation libraries, address autocomplete and CRM scripts that run long tasks on every keystroke.

    CLS problems: something arrives late and pushes everything down

    • Cookie banners and promo bars injected at the top of the page after it renders.
    • Images, videos and iframes without dimensions, so the browser doesn’t know how much space to reserve.
    • Web fonts swapping with very different metrics from the fallback font, reflowing every line of text.
    • Embeds such as Google Maps, YouTube, review widgets and social feeds that resize themselves once loaded.

    The fix order we use on business websites

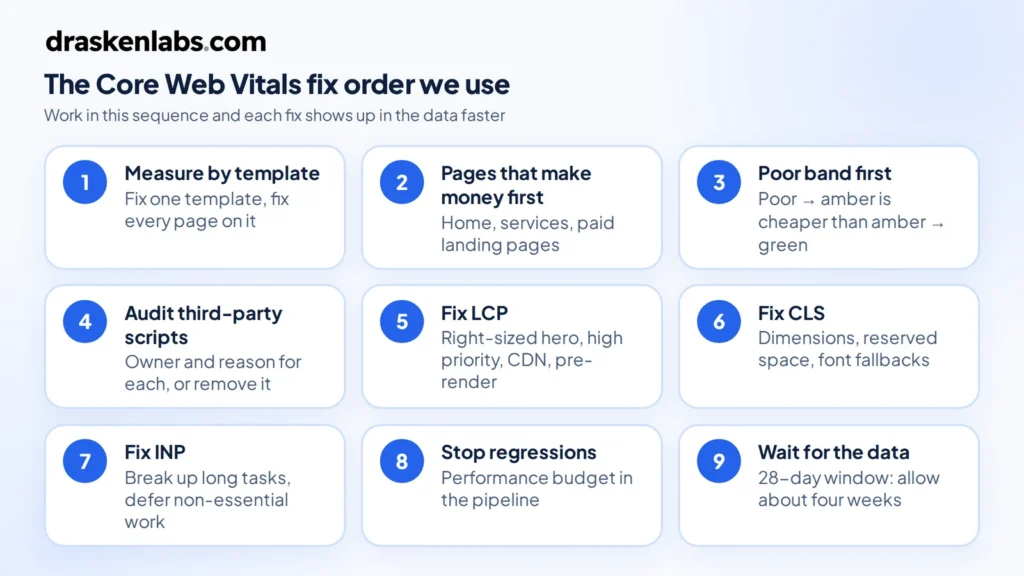
    Fixing these metrics goes faster when you work in the right order. This is the sequence we follow.

    1. Measure by page template, not by page. Search Console groups similar URLs. Your service pages likely share one template; fix the template and you fix them all.
    2. Start with the pages that make money. Homepage, service pages and paid landing pages come before the blog archive.
    3. Fix whichever metric is in the “poor” band first. Moving a metric from poor to needs-improvement usually takes less effort than pushing an amber metric to green.
    4. Audit third-party scripts. Every script should have an owner and a reason. Remove the ones nobody can justify, delay the rest until after the page is interactive, and load chat widgets on intent (a click on a chat button) rather than on page load.
    5. Fix LCP. Serve the hero image in a modern format at the right size, don’t lazy-load it, give it high fetch priority, cache pages at the edge with a CDN, and pre-render marketing pages rather than building them per request.
    6. Fix CLS. Set width and height on media, reserve space for banners and embeds, and use font fallbacks with matched metrics.
    7. Fix INP. Break up long JavaScript tasks, defer non-essential work, and replace heavy components with lighter ones. INP is usually the hardest of the three, so budget time for it.
    8. Stop it regressing. Add a performance budget to your deployment pipeline so a new plugin or a 4 MB image fails the build instead of reaching production. This is standard work in our platform engineering engagements.
    9. Wait for the data. Field data is a 28-day rolling window. Expect to wait around four weeks before Search Console fully reflects a fix.
    Core Web Vitals fix order in nine steps, from measuring by template to waiting for 28 days of field data
    The nine-step fix order, from measuring by template to waiting for field data.

    Hosting and platform choices that affect LCP, INP and CLS

    There is no platform that passes or fails these metrics by default. We’ve seen fast WordPress sites and slow custom React sites. What matters is how the site is built and served.

    • WordPress can pass comfortably with a lean theme, disciplined plugin use and full-page caching. It struggles when a heavy page builder and 30 plugins are all loading on every page.
    • Headless or static setups (for example a Next.js frontend with WordPress as the CMS, which is what our own site runs on) make fast LCP easier because pages are pre-rendered, but they can still fail INP if the frontend ships too much JavaScript.
    • Hosting matters mostly through server response time and caching. A CDN in front of a well-configured server fixes more LCP problems than moving to more complex infrastructure. A marketing website almost certainly doesn’t need Kubernetes, and serving static assets from a CDN is also one of the easier ways to cut cloud costs. If you want this handled end to end, see our cloud and DevOps service.

    If your website includes logged-in areas such as customer dashboards or portals, INP becomes a software engineering problem rather than a website tweak. That’s the point where it helps to treat the site as an application, which we cover in our guide to custom software development services.

    Questions to ask your web developer or agency

    You don’t need to understand every technical detail to hold your website partner accountable. Ask these:

    • Do our key templates pass all three metrics in field data, on mobile and desktop?
    • Which third-party scripts load on our pages, and who decided each one was needed?
    • Is the hero image lazy-loaded? What format and size is it served in?
    • Are pages cached and served from a CDN?
    • What stops a new plugin or image from making the site slower after launch?
    • How will we know if performance regresses before Google does?

    If the answers are vague, performance probably wasn’t part of the brief. That’s worth knowing when you’re comparing quotes, because performance work is one of the real differences between a cheap site and a professional one, as we explain in how much a professional business website costs in 2026.

    How Drasken Labs builds for Core Web Vitals

    We treat Core Web Vitals for business websites as a requirement from the start of a project, not an audit item after launch. In our website development projects that means choosing a rendering approach that suits the content, setting image and script budgets before design sign-off, reserving layout space for every component that loads late, and wiring real-user monitoring into production so we see a regression before it shows up in Search Console. You can see examples of the sites we build in our recent website work.

    Is your website failing LCP, INP or CLS?

    Send us the URL. We’ll tell you which metric is failing, on which templates, and what it would take to fix, whether that’s a focused performance pass or a rebuild.

    Get a Core Web Vitals review from Drasken Labs →

    Sources and further reading

    Are Core Web Vitals a Google ranking factor?

    Yes. They are part of Google’s page experience signals. Content relevance and quality still matter more, so Core Web Vitals tend to act as a tiebreaker between pages that are otherwise similar.

    If my Lighthouse score is 100, do I pass Core Web Vitals?

    Not necessarily. Lighthouse is a lab test on a simulated device. Google assesses Core Web Vitals using field data from real Chrome visitors. Check the Core Web Vitals report in Search Console or the field-data section of PageSpeed Insights.

    How long does it take for fixes to show in Search Console?

    Field data uses a rolling 28-day window, so expect roughly four weeks before a fix is fully reflected. You can use the “Validate fix” option in Search Console to start tracking it.

    Why does Search Console show no Core Web Vitals data for my site?

    Your pages probably don’t have enough real Chrome traffic to be included in the Chrome User Experience Report. Use lab tools for diagnosis and consider collecting your own real-user data with the web-vitals library.

    Can a WordPress website pass Core Web Vitals?

    Yes. WordPress sites pass regularly when they use a lightweight theme, a small set of plugins, page caching and a CDN. Heavy page builders and large plugin stacks are the usual reasons they fail.

    What replaced First Input Delay (FID)?

    Interaction to Next Paint (INP) replaced FID as a Core Web Vital in March 2024. INP measures responsiveness across all interactions during a visit, not just the first one.

    Which Core Web Vital should I fix first?

    Fix whichever metric is in the “poor” band on your most valuable page templates first. After that, LCP usually has the most direct effect on leads, and INP usually takes the most engineering effort.

  • Website Performance Optimization: A Practical Guide for 2026

    Website Performance Optimization: A Practical Guide for 2026

    Website performance optimization is the work of making pages load, respond and stay visually stable fast enough that real visitors on real devices never notice the wait. In 2026, that goal has a precise definition: Google’s Core Web Vitals, measured on your actual traffic.

    Here’s the problem most businesses run into. Someone runs a Lighthouse test, sees a score of 62, installs a caching plugin, re-runs the test, sees 71, and calls it done. Three months later, Search Console still flags the same pages as “Poor,” the site still feels sluggish on a mid-range Android phone, and nobody is sure why.

    That happens because website performance optimization isn’t about a single score. It’s a set of budgets — for server time, bytes, JavaScript execution and layout — and a slow page is one that has blown through at least one of them. Optimization means finding which budget is overspent and fixing that one first.

    This guide walks through the approach we use in website development projects at Drasken Labs: what to measure, where the time usually goes, the fixes for each Core Web Vital, and how to keep a site fast after launch. If you’re still scoping a new site, performance is also one of the factors that shapes what a professional business website costs.

    Short answer: Measure field data first (PageSpeed Insights or Search Console), not lab scores. Fix server response time and the Largest Contentful Paint element before anything else. Then cut JavaScript — especially third-party scripts — to fix responsiveness, reserve space for every image, embed and font to stop layout shifts, and set performance budgets so regressions get caught before release.

    What website performance optimization actually measures

    A fast website isn’t one that gets a green number in a testing tool. It’s one where visitors experience three things:

    • The main content appears quickly. The visitor can see the headline, hero image or product within a couple of seconds.
    • The page responds immediately. Tapping a menu, a filter or a form field produces visible feedback without a lag.
    • Nothing jumps around. Buttons don’t move just as someone goes to tap them, and text doesn’t shift when an ad or font loads.

    Google formalized these three experiences as the Core Web Vitals. They are part of Google’s page experience signals in search, but they matter just as much for conversion: a lead form that lags or shifts under someone’s thumb loses enquiries regardless of where the page ranks.

    Core Web Vitals in 2026: the three numbers that matter

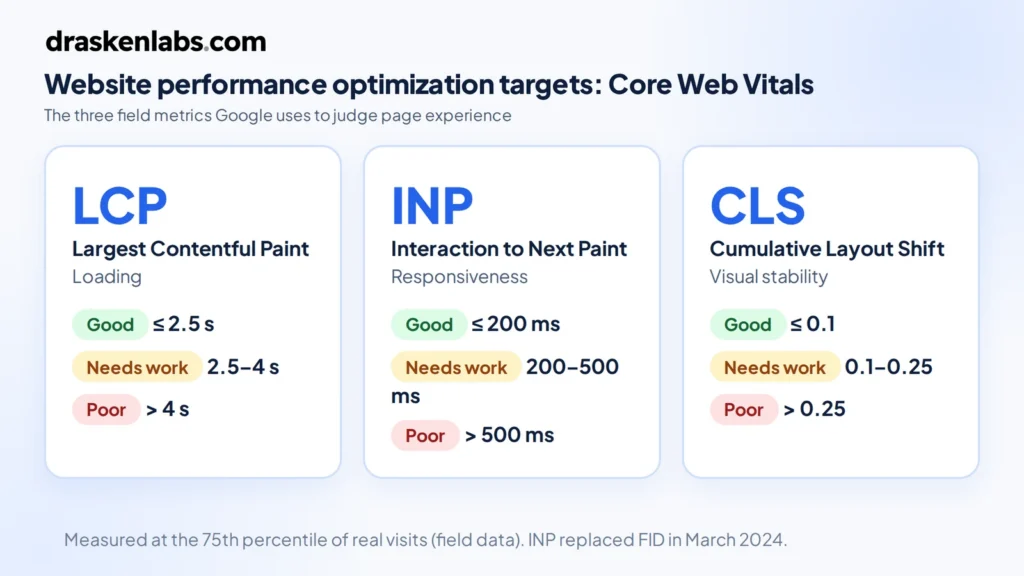
    MetricMeasuresGoodNeeds improvementPoor
    LCP — Largest Contentful PaintLoading: when the largest visible element renders≤ 2.5 s2.5–4.0 s> 4.0 s
    INP — Interaction to Next PaintResponsiveness: delay between an interaction and the next visual update≤ 200 ms200–500 ms> 500 ms
    CLS — Cumulative Layout ShiftVisual stability: unexpected movement of content≤ 0.10.1–0.25> 0.25

    Three details matter more than the thresholds themselves:

    • They’re measured at the 75th percentile. A page passes only if at least 75% of real visits meet the “good” threshold. Your fast office connection is irrelevant; the visitor on a crowded 4G network is not.
    • INP replaced First Input Delay in March 2024. FID only measured the delay before the first interaction was processed. INP looks at interactions across the whole visit, which makes it considerably harder to pass on JavaScript-heavy sites.
    • The thresholds haven’t changed. You may see claims that Google tightened LCP to 2.0 seconds. Google’s documentation still says 2.5 seconds. Aiming lower is a sensible safety margin, not a new rule.
    Website performance optimization targets: Core Web Vitals thresholds of LCP 2.5 s, INP 200 ms and CLS 0.1
    The three Core Web Vitals and the thresholds a page must meet at the 75th percentile.

    Lab data vs field data: why a 95 score can still fail

    There are two kinds of performance data, and confusing them is the most common reason website performance optimization work goes nowhere.

    Lab data comes from tools like Lighthouse, which load a page once in a simulated environment. It’s reproducible and useful for debugging, but it’s one synthetic visit on one simulated device.

    Field data comes from real Chrome users, collected in the Chrome User Experience Report (CrUX) over a rolling 28-day window. This is what Search Console reports and what Google uses for page experience. PageSpeed Insights shows both, with field data at the top when your site has enough traffic.

    A page can score 95 in Lighthouse and still fail INP in the field, because Lighthouse doesn’t click on anything. Real users do — and the chat widget, analytics tags and consent banner that sat idle during the lab test all compete for the main thread when a real visitor starts tapping.

    Use field data to decide what to fix. Use lab data to figure out why it’s slow and to verify fixes before they ship.

    Where the time actually goes: a diagnostic order

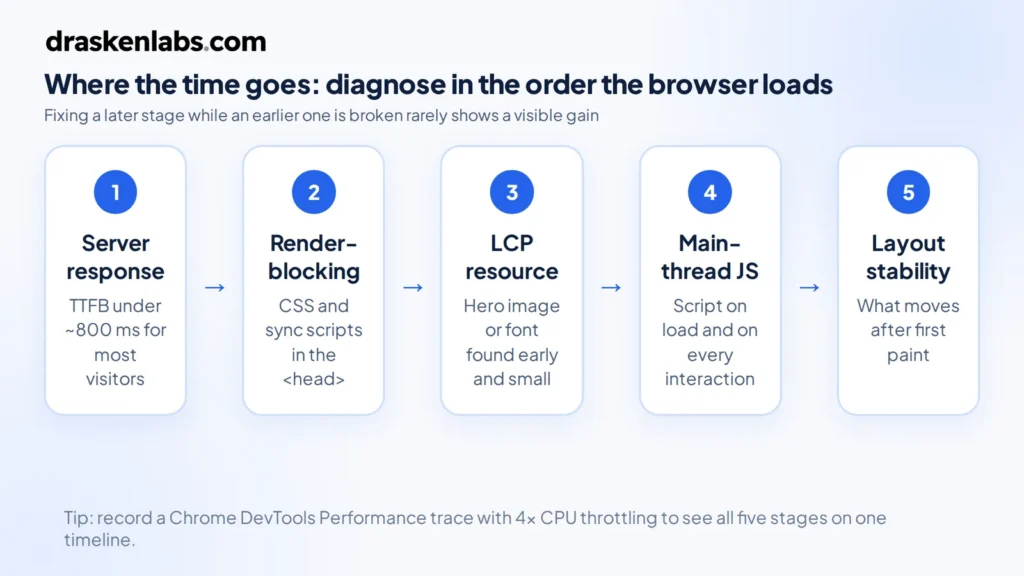
    When we audit a slow site, we work through the page load in the order the browser experiences it. Fixing a later stage while an earlier one is broken usually produces little visible improvement.

    1. Server response (TTFB). How long before the first byte of HTML arrives? If this is over roughly 800 ms for most visitors, nothing downstream can fully compensate.
    2. Render-blocking resources. CSS and synchronous scripts in the <head> that must download before anything paints.
    3. The LCP resource. Is the hero image or headline font discovered early, prioritized, and small enough?
    4. Main-thread JavaScript. How much script runs during load and on each interaction, and whose code is it?
    5. Layout stability. What moves after the first paint, and why?

    The Performance panel in Chrome DevTools shows all five on a single timeline. Record a load with CPU throttling set to 4x slowdown to approximate a mid-range phone; problems that are invisible on a developer laptop become obvious.

    Website performance diagnostic order: server response, render-blocking resources, LCP resource, main-thread JavaScript, layout stability
    Diagnose in the order the browser loads the page.

    How to fix Largest Contentful Paint (LCP)

    LCP is usually the hero image, a large heading, or a background image. Break its time into four parts — server response, resource discovery, download, and render — and fix whichever part dominates.

    Make the LCP image discoverable and high priority

    The browser can’t start downloading an image it hasn’t found yet. Images set via CSS backgrounds, injected by JavaScript sliders, or lazy-loaded are found late. Use a plain <img> in the HTML and tell the browser it matters:

    Engineers reviewing a deployment dashboard

    Never add loading="lazy" to the LCP image. Lazy loading is for images below the fold; on the hero, it delays exactly the element Google is timing.

    Serve the right format at the right size

    • Use AVIF or WebP, with JPEG as a fallback where your pipeline requires it.
    • Serve responsive sizes through srcset so a phone doesn’t download a 2,400-pixel desktop image.
    • Compress properly. A hero image rarely needs to exceed 150–250 KB.

    Remove render-blocking work

    • Inline the critical CSS needed for above-the-fold content and load the rest without blocking.
    • Add defer to scripts that don’t need to run before the first paint — which is most of them.
    • Self-host fonts, subset them to the characters you use, preload the one or two files needed for the first screen, and use font-display: swap or optional.

    Choose a rendering strategy that fits the page

    If the HTML is generated by client-side JavaScript, the LCP element doesn’t exist until that JavaScript downloads and runs. For content pages, that’s an avoidable delay.

    StrategyHow it worksBest for
    Static generation (SSG)HTML built ahead of time and served from a CDNMarketing pages, blogs, documentation
    Incremental regeneration (ISR)Static pages rebuilt in the background on a schedule or on publishCMS-driven sites, product catalogs
    Server-side rendering (SSR)HTML generated per requestPersonalized or frequently changing pages
    Client-side rendering (CSR)Browser builds the page from JavaScriptLogged-in app screens where SEO doesn’t matter

    A business website with a headless CMS usually belongs in the first two rows. Serving a marketing page as a client-rendered single-page app is one of the most expensive performance mistakes we see.

    How to fix Interaction to Next Paint (INP)

    INP fails when the browser’s main thread is busy at the moment a visitor interacts. The browser can only do one thing at a time on that thread; if a 400 ms script is running when someone taps “Menu,” the tap waits.

    Ship less JavaScript

    The most effective INP fix is removing code, not optimizing it. Audit the bundle and ask of each dependency whether the page needs it at all. Carousels, animation libraries and full UI frameworks often ship on pages that use a fraction of them.

    Break up long tasks

    Any task over 50 ms blocks interactions. Split heavy work into smaller chunks and yield back to the browser between them, so input can be handled in the gaps. In event handlers, do the visual update first — open the menu, show the spinner — and defer the analytics call or data processing until after the next paint.

    Reduce hydration cost

    Frameworks that render on the server and then “hydrate” in the browser can re-run large amounts of code on load. Partial hydration, server components, and loading interactive islands only when they scroll into view all reduce that cost.

    Keep the DOM reasonable

    Very large DOMs make every style recalculation and layout slower. Pages with many thousands of nodes — often from page builders or mega-menus rendered in full on every page — take longer to update after each interaction.

    How to fix Cumulative Layout Shift (CLS)

    CLS is usually the easiest vital to fix, because the causes are predictable:

    • Images and videos without dimensions. Always set width and height attributes, or use CSS aspect-ratio, so the browser reserves space before the file arrives.
    • Embeds, ads and iframes. Give their containers a fixed minimum height.
    • Injected banners. Cookie notices, promo bars and “download our app” prompts that push content down. Overlay them instead of inserting them above content.
    • Web fonts. A fallback font with different metrics causes text to reflow when the web font loads. Use size-adjusted fallbacks so both fonts occupy the same space.
    • Animations. Animate transform and opacity, not top, height or margin.

    Server, hosting and caching

    Front-end work can’t rescue a slow origin. If time to first byte is high, look here first.

    • Put a CDN in front of everything. Static assets and, where possible, full HTML pages should be served from an edge location near the visitor. For a business serving India, the Gulf and Australia from one origin, this alone can remove hundreds of milliseconds.
    • Set proper cache headers. Fingerprinted assets (app.3f9a2c.js) can be cached for a year with Cache-Control: public, max-age=31536000, immutable. HTML needs shorter lifetimes or revalidation.
    • Enable Brotli compression and HTTP/3 on your CDN or reverse proxy.
    • Fix slow backend queries. On dynamic sites, TTFB problems often trace back to unindexed database queries, N+1 query patterns, or uncached API calls to third-party services on every request.
    • Add an object cache. Redis or a similar cache in front of expensive queries keeps response time flat under load.

    None of this requires a complicated platform. A slow marketing site is almost never a container orchestration problem, and you probably don’t need Kubernetes to fix it. What it needs is correct managed hosting and CDN setup. There’s a cost benefit too: serving cached assets from the edge reduces origin load and egress, which is one of the easier wins in cloud cost optimization.

    Third-party scripts: the performance budget nobody owns

    On many business websites we audit, the site’s own code is not the biggest problem. Third-party scripts are: analytics, tag managers, advertising pixels, heatmaps, A/B testing tools, chat widgets, review badges and social embeds.

    Each one was added by a different person for a sensible reason, and none of them were ever removed. Together they can easily account for most of the JavaScript executed on a page — and they run on the same main thread as your menu and forms.

    • Inventory every tag and name an owner for each. If nobody can say what a script is for, remove it.
    • Load non-essential scripts after the page becomes interactive, or on first user interaction.
    • Use facades for heavy embeds. Show a static preview of a chat widget or video player and load the real thing only when clicked.
    • Consider server-side tagging for analytics and ad conversions, which moves work off the visitor’s device.
    • Treat the tag manager as production code. Changes there can undo weeks of website performance optimization work in one publish.

    WordPress performance: specific traps

    WordPress powers a large share of business websites, and it can be very fast. It usually isn’t, for a few recurring reasons:

    • Plugin accumulation. Every plugin can add its own CSS, JavaScript and database queries — often on every page, whether used there or not.
    • Page builders. Visual builders tend to produce deep, heavy markup and large style sheets. They trade development speed for runtime cost.
    • Stacked optimization plugins. Two caching or minification plugins fighting each other is common, and it often breaks things rather than speeding them up.
    • No persistent object cache. Without Redis or Memcached, WordPress re-runs the same queries on every uncached request.
    • Cheap shared hosting with slow PHP workers, which shows up directly as high TTFB.

    For content-heavy sites where performance is a priority, a headless setup — WordPress as the editing interface, with a static or incrementally regenerated front end served from a CDN — removes most of these problems. It’s the architecture we run for our own site. Where the site needs logic beyond content, such as portals, bookings or integrations, that becomes custom software development rather than theme configuration.

    Keeping it fast: budgets and monitoring

    Performance decays. A new hero video, a marketing tag, a plugin update — each one small, and six months later the site is back where it started. The fix is to treat website performance optimization as a constraint that’s checked continuously, not a project that ends.

    Set performance budgets

    Define limits that fail a build or block a release when exceeded. For example:

    • LCP under 2.0 s in lab tests on a throttled mobile profile
    • Total JavaScript under 200 KB compressed for content pages
    • No single image over 250 KB
    • No new third-party origin without review

    Lighthouse CI can run these checks on every pull request.

    Collect real-user monitoring

    CrUX data arrives with a 28-day lag and only at page-group level. Real-user monitoring (RUM) — sending Core Web Vitals from your visitors’ browsers to your own analytics — shows regressions within hours and tells you which device, page type and element is responsible.

    One warning from experience: tag RUM data by page template or route (/blog/[slug]), not by full URL, user ID or session. Unbounded labels are how a monitoring setup turns into a surprise bill, which we covered in detail in our piece on high-cardinality metrics.

    Pair RUM with alerting — for example, notify the team when p75 LCP on product pages exceeds 2.5 s for an hour — and performance becomes something you see before customers do. That’s the same principle behind the observability work we do for application backends, applied to the front end.

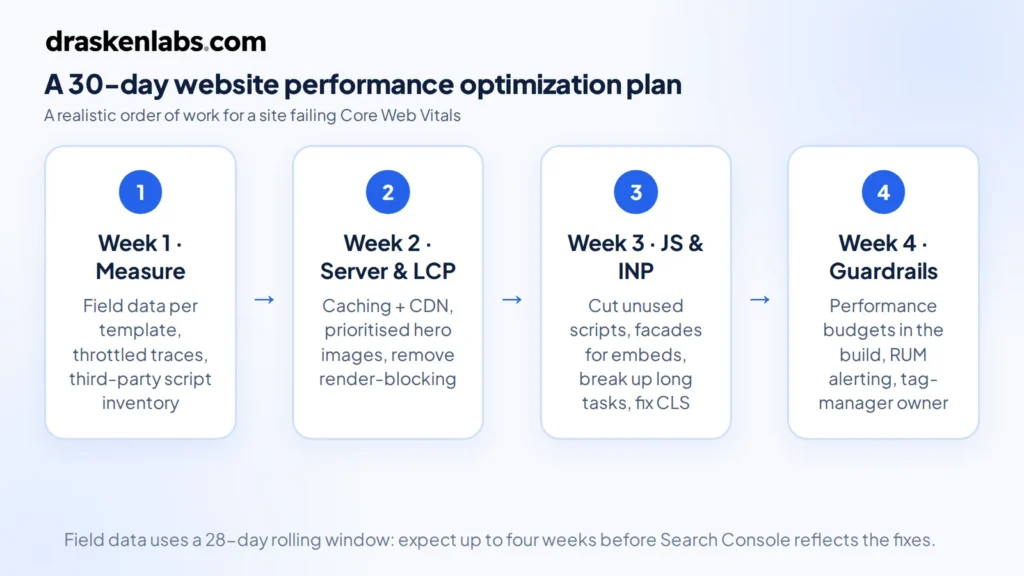
    A 30-day website performance optimization plan

    If you’re starting from a site that’s failing Core Web Vitals, this is a realistic order of work:

    1. Week 1 — Measure. Pull field data from Search Console and PageSpeed Insights for your key templates: home, service pages, blog posts, product or landing pages. Record a throttled DevTools trace of each. Inventory every third-party script.
    2. Week 2 — Server and LCP. Fix TTFB with caching and a CDN. Make LCP images discoverable, prioritized and properly sized. Remove render-blocking CSS and scripts.
    3. Week 3 — JavaScript and INP. Remove unused scripts and dependencies, defer the rest, add facades for heavy embeds, and break up long tasks in your own code. Fix CLS causes in the same pass.
    4. Week 4 — Guardrails. Add performance budgets to the build, set up RUM and alerting, and document who owns the tag manager.

    Expect field data to take up to four weeks to reflect the changes, because of CrUX’s rolling window. Watch your RUM data in the meantime.

    A 30-day website performance optimization plan: measure, fix server and LCP, fix JavaScript and INP, add guardrails
    A 30-day website performance optimization plan, week by week.

    How Drasken Labs approaches website performance

    We treat website performance optimization as an engineering constraint from the start of a project, not a plugin added at the end. In practice, that means:

    • Architecture first. Choosing a rendering strategy and hosting setup that suits each page type before any design is built.
    • Budgets in the build. Performance limits enforced in CI, so regressions are caught in review rather than in Search Console.
    • Infrastructure we operate. CDN, caching and hosting configured and run by the same team that built the site.
    • Monitoring after launch. Real-user Core Web Vitals tracked per template, with alerts when something slips.

    For existing sites, we start with a performance audit: field data, traces of key templates, and a third-party script inventory, ending in a prioritized list of fixes with expected impact. You can see how we build and run sites in our recent work.

    Is your website failing Core Web Vitals?

    Send us the URL and your key pages. We’ll tell you where the time is going and what to fix first.

    Request a performance audit

    Final thoughts

    Website performance optimization isn’t about chasing a perfect Lighthouse score. It’s about making sure the visitor on an average phone and an average network sees your content quickly, can interact with it immediately, and isn’t fighting a page that moves under their thumb.

    The order matters: measure real users, fix the server and the LCP element, cut JavaScript — especially scripts you didn’t write — stabilize the layout, and then put budgets and monitoring in place so the work doesn’t quietly unravel.

    Most sites don’t need a rebuild to pass Core Web Vitals. They need someone to find the two or three budgets that are overspent and fix those first.

    Sources and further reading

    What is website performance optimization?

    Website performance optimization is the process of improving how quickly a website loads, how fast it responds to interactions, and how visually stable it is while loading. In practice, it’s measured with Google’s Core Web Vitals: Largest Contentful Paint, Interaction to Next Paint and Cumulative Layout Shift.

    What are good Core Web Vitals scores in 2026?

    A page is rated “good” when LCP is 2.5 seconds or less, INP is 200 milliseconds or less, and CLS is 0.1 or less, measured at the 75th percentile of real visits.

    Does website speed affect SEO?

    Yes, but modestly. Core Web Vitals are part of Google’s page experience signals, which act more like a tie-breaker between similarly relevant pages than a primary ranking factor. Speed has a larger and more direct effect on bounce rate and conversion.

    Why is my PageSpeed score high but Core Web Vitals still failing?

    The PageSpeed score is lab data from one simulated visit. Core Web Vitals in Search Console are field data from real users over 28 days. Real visitors use slower devices and networks, and they interact with the page, which exposes INP problems that lab tests don’t trigger.

    How long does it take for Core Web Vitals improvements to show?

    Field data in the Chrome User Experience Report uses a rolling 28-day window, so improvements typically take up to four weeks to be fully reflected in Search Console and PageSpeed Insights.

    Will a caching plugin fix a slow WordPress site?

    It helps with server response time, but it doesn’t fix heavy JavaScript, unoptimized images, layout shifts or third-party scripts. Most WordPress sites that fail Core Web Vitals need changes to plugins, themes and scripts, not just caching.

    How much does website performance optimization cost?

    It depends on the cause. Fixing images, caching and a handful of scripts is a small, contained engagement. If the site is built on a heavy page builder or renders content client-side, meaningful gains may require rebuilding key templates. An audit is the fastest way to find out which case you’re in.

  • Freelancer vs Web Development Company in 2026: Which Should You Hire?

    Freelancer vs Web Development Company in 2026: Which Should You Hire?

    Freelancer vs web development company is a common decision for businesses planning a new website. A freelancer can be a practical choice for a small, clearly defined project, while a web development company can provide broader expertise, structured development, and ongoing support for more complex requirements.

    Short answer: hire a freelancer when the job is small, clearly defined, and you have the time to manage it yourself. Hire a web development company when the website has to generate business, connect to other systems, or keep working reliably long after launch.

    Most bad website projects are not caused by bad developers. They are caused by a mismatch: a company hired to build a single landing page, or one freelancer asked to deliver what is really a software project with design, integrations, SEO, hosting and security all riding on one person.

    We are a website development company, so read this with that in mind. We have also told plenty of prospective clients that a good freelancer was the better fit for them. This guide is the same reasoning we use in those conversations.

    The real difference is not price

    The obvious difference is cost: freelancers usually quote less. But the thing you are actually buying is different in each case.

    With a freelancer, you are buying one person’s skills and one person’s availability. If that person is a strong designer, you get strong design. If they are weaker at backend work, security or SEO, the project inherits those gaps. And if they get sick, take on a bigger client, or simply stop replying, the project stops.

    With a web development company, you are buying a team and a process. A professional website touches several distinct skills: UX and visual design, frontend development, backend and integrations, technical SEO, testing, hosting and deployment, and project management. A company can put a different specialist on each, review each other’s work, and keep going if someone is unavailable.

    So the real question is not “who is cheaper?” It is: how many of those skills does your project actually need, and who will cover the ones a single person can’t?

    When a freelancer is the right choice

    A good freelancer can be an excellent choice, and often the most sensible one. Freelancers tend to work best when:

    • The scope is small and fixed. A landing page, a portfolio, a small brochure website on a proven template, or a specific fix on an existing site.
    • You can manage the project yourself. You will write the brief, provide the content, review the work and make the decisions.
    • The budget is tight and a simple online presence is genuinely all the business needs right now.
    • You need one specific skill, such as a WordPress theme tweak, a Figma design, or speeding up an existing page.
    • You have found a proven specialist with live work you can inspect and references you can call.

    Advantages of hiring a freelancer

    • Lower cost, because there is little or no company overhead.
    • Direct communication with the person doing the work.
    • Fast start on small jobs, with no lengthy discovery phase.
    • Flexibility on process, timing and small changes.

    Disadvantages of hiring a freelancer

    • Single point of failure. Illness, holidays, a bigger client or a career change can pause or end your project.
    • Limited skill coverage. Few individuals are equally strong at design, development, SEO, security and hosting.
    • You become the project manager. Planning, chasing and quality checking fall on you.
    • Weaker accountability. Agreements are often informal, and enforcing them across cities or countries is hard.
    • Thin post-launch support. Maintenance is usually best effort, fitted around other clients.

    When a web development company is the right choice

    A company earns its higher price when the website is part of how the business makes money. Choose a company when:

    • The website is a lead-generation or sales channel, and its performance affects revenue.
    • It needs integrations with a CRM, payment gateway, booking system, ERP, WhatsApp or internal APIs.
    • SEO matters from day one, which means site architecture, not just meta tags added at the end.
    • It handles data or logins, such as customer accounts, dashboards, portals or payments.
    • You need it maintained and extended for years, not delivered and left alone.
    • You don’t have time to manage developers and want one accountable party.

    Once a website starts handling business logic (accounts, payments, workflows, data) it stops being a web design job and becomes a custom software development project. That is where the gap between one person and a team becomes very visible.

    Advantages of hiring a web development company

    • Multiple specialists: design, frontend, backend, QA, DevOps and project management.
    • A defined process with scoping, milestones, testing and handover.
    • Continuity: the project doesn’t stop if one person is unavailable.
    • Formal contracts, tax invoices and a registered entity you can hold accountable.
    • Structured support after launch, including maintenance, hosting and monitoring.
    • Capacity to grow with you, from website to portal to app.

    Disadvantages of hiring a web development company

    • Higher cost, since you are paying for the team, process and overhead.
    • Slower to start, because good companies scope before they build.
    • Less flexible for tiny changes, which may go through a change-request process.
    • Uneven quality across the market. Some agencies sell senior expertise and hand the work to juniors or subcontracted freelancers.

    Freelancer vs web development company: side-by-side

    FactorFreelancerWeb development company
    Upfront costUsually lowerUsually higher
    Speed to startOften immediateScoping and planning first
    Skill coverageOne person’s strengthsDesign, development, QA and DevOps together
    Project managementMostly on youDedicated lead or project manager
    Quality assuranceSelf-testedSeparate review and testing
    Availability riskHigh: one personLow: team continuity
    AccountabilityOften informal agreementsContracts, invoices, registered business
    Security practicesDepends on the individualShould be defined (ask to see them)
    Post-launch supportBest effortMaintenance plans and response times
    Growing the projectHard to add capacityCan add people and skills
    Best forSmall, fixed, low-risk jobsBusiness-critical sites and web apps

    The hidden costs nobody quotes you

    The invoice is only part of what a website costs. (For typical budgets by website type, see our guide on how much a professional business website costs in 2026.) The costs that don’t appear on a quote are often the ones that decide whether the cheaper option really was cheaper.

    Hidden costs of the freelancer route

    • Your time. Every hour you spend writing briefs, chasing updates and testing pages is an hour not spent running the business.
    • Rework. A site that looks right but loads slowly, breaks on mobile or can’t be indexed properly often has to be partly rebuilt.
    • Handover pain. When a freelancer moves on, the next developer has to reverse-engineer undocumented code, plugins and server setup.
    • Ownership gaps. Domains, hosting and analytics accounts registered in the freelancer’s name can be very hard to recover.

    Hidden costs of the company route

    • Change requests. Anything outside the agreed scope is usually billed separately. Agree how changes are priced before you sign.
    • Over-engineering. Some companies sell complex solutions to simple problems. A five-page site does not need a custom platform.
    • Lock-in. Proprietary builders or hosting you can’t move away from make every future change more expensive.

    Which should you choose for your project?

    What you are buildingUsually the better fit
    Single landing page or campaign pageFreelancer
    Small brochure site on a proven templateFreelancer or small studio
    Lead-generation business website with CMS, SEO and analyticsCompany, or a senior freelancer with a proven track record
    E-commerce store with payments, inventory and shippingCompany
    Customer portal, SaaS or web applicationCompany or engineering team
    Website plus a mobile app sharing one backendCompany
    Ongoing product development over yearsCompany or dedicated team

    A useful test: if the website went down for three days, what would it cost you? If the honest answer is “not much,” a freelancer is probably fine. If the answer involves lost leads, failed payments or customers who can’t log in, you need a team that can respond.

    The middle options

    It isn’t always a binary choice:

    • Small studios of two to five people often combine freelancer pricing with some of a company’s continuity.
    • Start with a freelancer, move up later. This works well if you insist on clean, documented code and keep every account in your own name from the start.
    • Split the work. A company handles the build, hosting and integrations. A freelancer or your own team handles routine content updates in the CMS.
    • Company for the platform, freelancer for campaigns. The core site stays stable while campaign pages are produced quickly and cheaply.

    Red flags to watch for

    When hiring a freelancer

    • No portfolio of live websites you can open and test on your phone.
    • Wants to register your domain or hosting in their own name.
    • No written scope, timeline or payment milestones.
    • A price far below every other quote, with no explanation.
    • Can’t explain how they will handle SEO, security or backups.

    When hiring a web development company

    • The salesperson can’t answer basic technical questions, and you never meet an engineer before signing.
    • They won’t tell you who will actually work on your project.
    • Every project is squeezed into the same template package.
    • The change-request policy is vague.
    • No case studies or references you can verify.

    Questions to ask before you hire anyone

    Whether you choose a freelancer or a company, ask these before signing:

    • Who will actually do the work? Named people, not “our team.”
    • Will the domain, hosting, analytics and CMS accounts be in my name? The answer should be yes.
    • Do I receive the source code and design files? Get it in writing.
    • How do you test before launch? Look for mobile, browser, speed, form and security checks.
    • How is SEO handled during the build? Site structure, page speed and indexability, not just meta tags. Google’s own SEO Starter Guide is a good baseline to compare against.
    • Is the site accessible? Ask whether they design against WCAG guidelines.
    • What happens if you are unavailable for two weeks? The answer tells you a lot about continuity.
    • What does support cost after launch, and how quickly do you respond when the site is down?
    • How are changes priced once the project is under way?

    How Drasken Labs approaches this

    Drasken Labs is an engineering-led development company. We scope before we quote, and if a project is small enough that a good freelancer would serve you better, we say so.

    When a company is the right fit, the same team handles the whole lifecycle: design and development, integrations, hosting and DevOps, and monitoring after launch. You own your code, your domain and your accounts from day one. Our website development service covers business sites, CMS builds and e-commerce, and larger projects move into custom software development when the requirements call for it.

    You can see how this works in practice in our work with GatimaanPayments and the TheMMK Studio website, or browse all of our projects.

    Final thoughts

    Neither option is better in general. A freelancer is the efficient choice for small, well-defined work you can manage yourself. A web development company is the safer choice when the website is a business system that has to perform, integrate and keep running.

    Decide what the website needs to do, estimate what it would cost you if it failed, and hire accordingly.

    Not sure which your project needs?

    Tell us what you are building. We will give you a straight answer on scope, even if that answer is “hire a freelancer.”

    Talk to the Drasken Labs team

    Sources and further reading

    Is it cheaper to hire a freelancer or a web development company?

    A freelancer is usually cheaper upfront because there is less overhead. The total cost can end up higher if the project needs rework, runs late or has to be handed to a new developer. For small, fixed-scope work a freelancer is usually the more economical option. For business-critical websites, the lower risk of a company often makes it cheaper over the life of the site.

    Is a freelancer good enough for a small business website?

    Often, yes. If you need a simple brochure website, the freelancer has live work you can check, and you keep the domain and hosting in your own name, a freelancer can deliver a good result. Consider a company once the website needs integrations, e-commerce, customer logins or ongoing development.

    What are the risks of hiring a freelance web developer?

    The main risks are availability (one person is a single point of failure), gaps in skills such as security or SEO, limited testing, informal agreements that are hard to enforce, and handover problems if the freelancer moves on. Written scopes, milestone payments and keeping every account in your name reduce most of them.

    How do I make sure I own my website?

    Register the domain, hosting, analytics and CMS accounts in your own name, and add the developer as a user rather than the owner. Your contract should state that you receive the source code, design files and database on final payment.

    Can I start with a freelancer and move to a company later?

    Yes, and many businesses do. It goes smoothly when the original site uses mainstream technology, the code is documented and every account is in your name. Undocumented custom code or accounts held by the freelancer make the move slower and more expensive.

    Should I hire a web development company in India?

    Indian development companies serve clients worldwide and can offer strong value. Judge any company, wherever it is based, on the same things: who does the work, how the project is managed and tested, who owns the code, how communication across time zones works, and what support looks like after launch.

  • How Much Does a Professional Business Website Cost in 2026?

    How Much Does a Professional Business Website Cost in 2026?

    A professional business website can cost anywhere from a few hundred dollars to tens of thousands of dollars, depending on what you need the website to accomplish.

    In 2026, businesses are no longer building websites simply to have an online presence. A modern business website may need to generate leads, rank in search engines, integrate with a CRM, support marketing campaigns, load quickly, work across devices, and provide a foundation for future digital products.

    As a result, the question is not simply “How much does a website cost?” but rather:

    “What kind of website does my business actually need?”

    For planning purposes, typical website development budgets can look like this:

    Website typeTypical 2026 budget
    Basic/template business website$500–$2,000
    Professional business website$2,000–$7,500
    Custom business website$5,000–$15,000+
    Advanced website/web platform$15,000–$50,000+

    These are general planning ranges rather than fixed market prices. The actual cost depends on the website’s design, functionality, content, integrations, technology, SEO requirements, and development scope.

    What Determines the Cost of a Professional Business Website?

    Two websites can have the same number of pages and completely different development costs.

    A five-page website using an existing template may take considerably less work than a five-page website with custom UX, animations, integrations, technical SEO, a CMS, analytics, and custom backend functionality.

    Here are the major factors that influence the price.

    1. Website size and complexity

    The number of pages is one factor, but it isn’t the most important one.

    A simple company website might contain:

    • Home
    • About
    • Services
    • Case Studies
    • Contact

    A larger website might include:

    • Multiple service categories
    • Industry pages
    • Location pages
    • Blog/resource center
    • Case studies
    • Careers
    • Knowledge base
    • Customer portal
    • Product pages

    More pages generally mean more content, design and development work. However, the complexity of each page matters just as much as the page count.

    2. Design and user experience

    A template-based website can be relatively inexpensive because much of the visual structure already exists.

    A custom-designed website requires more work.

    The process may involve:

    • User research
    • Information architecture
    • Wireframes
    • UX design
    • Visual design
    • Responsive layouts
    • Design systems
    • Interactive elements
    • Conversion optimization

    For businesses competing in crowded markets, the website often needs to communicate credibility within seconds. This makes UX and visual design an important part of the overall investment.

    3. Custom development

    A website can range from a collection of CMS pages to a custom software system.

    For example, a marketing website may only require a CMS and contact forms.

    A more sophisticated website might require:

    • Custom APIs
    • User authentication
    • Customer dashboards
    • Database functionality
    • CRM integration
    • Payment processing
    • Booking systems
    • Third-party APIs
    • Automated workflows

    Once a website starts handling business logic, it moves beyond conventional web design and becomes a software development project.

    4. Content creation

    Website development and website content are related, but they are not always the same service.

    A professional website may require:

    • Website copywriting
    • Service descriptions
    • Product descriptions
    • Case studies
    • Blog content
    • Photography
    • Illustrations
    • Videos
    • Infographics

    If the development team is also responsible for producing or restructuring the content, the project scope increases.

    5. Search engine optimization

    SEO should not be treated as something that is added after a website has been developed.

    A search-friendly website needs an appropriate architecture from the beginning.

    This can include:

    • Search-friendly URLs
    • Logical information architecture
    • Internal linking
    • Metadata
    • Structured data
    • Semantic HTML
    • Indexability
    • Mobile responsiveness
    • Performance optimization
    • Image optimization
    • Content structure

    Technical SEO is therefore one of the factors that can affect website development cost.

    6. Integrations

    Modern business websites frequently need to communicate with other systems.

    Examples include:

    • CRM systems
    • Email marketing platforms
    • Payment gateways
    • Analytics platforms
    • Marketing automation tools
    • Customer support systems
    • ERP systems
    • Booking platforms
    • WhatsApp integrations
    • Internal business APIs

    A simple contact form is relatively straightforward.

    Synchronizing leads between a website, CRM and marketing automation system is a different level of development.

    7. Performance, security and scalability

    A professional website also needs to work reliably after launch.

    Depending on the project, development may include:

    • Performance optimization
    • Caching
    • Image optimization
    • Security configuration
    • Form protection
    • Access control
    • Backup strategy
    • Monitoring
    • Error tracking
    • Scalable hosting architecture

    These requirements may not be visible to visitors, but they contribute significantly to the quality of the finished system.


    Website Development Cost by Type

    Not every business needs the same type of website.

    Basic business website: $500–$2,000

    A basic website is generally appropriate for businesses that primarily need an online presence.

    It may include:

    • A pre-built theme or template
    • A small number of pages
    • Responsive design
    • Contact form
    • Basic CMS
    • Basic analytics
    • Basic SEO configuration

    This approach keeps the initial investment low, but customization and advanced functionality may be limited.

    Professional business website: $2,000–$7,500

    A professional business website is designed around the company’s brand, audience and business objectives.

    It may include:

    • Custom or heavily customized design
    • Conversion-focused page structure
    • Responsive UI
    • CMS
    • SEO-ready architecture
    • Analytics
    • Lead-generation forms
    • Performance optimization
    • Third-party integrations
    • Professional content structure

    This is often the range businesses consider when the website is an important part of their marketing and sales operation.

    Custom business website: $5,000–$15,000+

    A custom website goes further than a conventional marketing website.

    It may involve:

    • Fully custom UI/UX
    • Custom frontend development
    • Custom backend functionality
    • API integrations
    • CRM integrations
    • Advanced content management
    • Customer portals
    • Custom workflows
    • Advanced SEO architecture

    The exact price depends heavily on the technical requirements.

    Advanced web platform: $15,000–$50,000+

    At this level, you’re often building a software product rather than simply a company website.

    Examples include:

    • SaaS platforms
    • Customer portals
    • Membership platforms
    • Complex e-commerce systems
    • Marketplace platforms
    • Booking platforms
    • Data dashboards
    • Enterprise web applications

    These projects require considerably more planning, engineering, testing and ongoing maintenance.


    What Should a Professional Business Website Include in 2026?

    A professional website should do more than look good.

    At a minimum, businesses should consider the following.

    Responsive design

    The website should provide a usable experience across:

    • Desktop
    • Laptop
    • Tablet
    • Mobile

    Clear conversion paths

    Visitors should understand what to do next.

    Depending on the business, this could mean:

    • Request a quote
    • Book a consultation
    • Call the company
    • Submit an inquiry
    • Request a demo
    • Purchase a product
    • Download a resource

    SEO-ready architecture

    The website should provide a solid technical foundation for organic search.

    Analytics

    Businesses should be able to understand:

    • Where visitors come from
    • Which pages they visit
    • Which campaigns generate traffic
    • Where users convert
    • Which pages need improvement

    Content management

    For businesses that regularly publish content, a CMS can make it easier for internal teams to update the website without requiring developers for every change.

    Security

    Forms, authentication, APIs and administrative functionality should be appropriately protected.

    Performance

    A professional website should be designed with page speed and efficient delivery in mind.

    Scalability

    The architecture should account for what happens when the company adds:

    • More services
    • More content
    • New integrations
    • New markets
    • New functionality

    Cheap Website vs. Professional Website

    The difference between a low-cost website and a professional website is not simply the number on the invoice.

    It is usually the amount of work behind the website.

    AreaLow-cost approachProfessional approach
    DesignTemplate-basedCustom or strategically customized
    UXBasicDesigned around user journeys
    ContentCustomer-providedStructured and optimized
    SEOBasic setupConsidered throughout architecture
    PerformanceVariableDeliberately optimized
    IntegrationsLimitedCustom integrations where required
    ScalabilityOften limitedPlanned around future requirements
    AnalyticsBasicConnected to business goals
    SupportVariesDefined development/support process

    A low-cost website isn’t necessarily the wrong choice.

    If your business only needs a simple online presence, spending tens of thousands of dollars may not make sense.

    The important question is whether the website’s capabilities match the business requirement.


    How Much Should a Business Budget for a Website?

    Instead of choosing a budget based purely on the number of pages, start with the business objective.

    A new or small business

    If the primary goal is establishing an online presence and generating basic inquiries, a budget around $1,500–$4,000 may be appropriate depending on the scope.

    An established small or medium-sized business

    If the website is an important lead-generation and marketing channel, a budget around $3,000–$10,000 can provide room for better design, content structure, SEO, integrations and conversion optimization.

    A B2B or technology company

    Companies selling higher-value services or software may require a more sophisticated website.

    A budget of $5,000–$15,000+ may be appropriate when the project includes custom design, technical SEO, integrations and more extensive content architecture.

    A company building a web application

    Once the website includes authentication, dashboards, databases, payments, complex workflows or substantial business logic, it should be budgeted as a software project.

    These projects can start around $15,000 and increase substantially depending on scope.


    How Much Does Website Development Cost in India?

    India has a broad website development market, ranging from individual freelancers and small teams to established software development companies.

    Consequently, there is no single “Indian website development price.”

    You may find:

    • Very low-cost freelancer packages
    • Template-based agency packages
    • Mid-market professional development services
    • Custom software development companies
    • Enterprise development teams

    The difference between these options is usually reflected in scope, process, engineering expertise, design, project management, support and the complexity of the final product.

    For international businesses, the more useful question isn’t simply whether a development company is based in India.

    Instead, evaluate:

    • What is included?
    • Who owns the code?
    • How is the project managed?
    • How is quality tested?
    • How is SEO handled?
    • What happens after launch?
    • Can the team support future development?
    • Can the company work effectively across time zones?
    • Are security and performance considered?
    • Is the architecture capable of evolving with the business?

    Location can affect pricing, but it should not be the only factor used to evaluate a development partner.


    How Does Drasken Labs Approach Business Website Development?

    At Drasken Labs, we approach a business website as a digital business system, rather than simply a collection of pages.

    The process can include four major stages.

    1. Understand the business

    Before development, we look at:

    • Business objectives
    • Target customers
    • Existing website
    • Competitors
    • Services or products
    • Lead-generation requirements
    • Existing technology
    • Future requirements

    2. Plan the website

    We define:

    • Sitemap
    • Page hierarchy
    • User journeys
    • Content structure
    • Conversion paths
    • SEO architecture
    • Technical requirements

    This helps ensure that the website has a purpose before development begins.

    3. Design and develop

    Depending on the project, development can include:

    • Custom responsive UI
    • Frontend development
    • CMS integration
    • Backend development
    • API integrations
    • CRM integrations
    • Analytics
    • SEO implementation
    • Performance optimization

    The technology is selected according to the requirements rather than forcing every project into the same stack.

    4. Test and launch

    Before launch, the website can be evaluated for:

    • Responsive behavior
    • Browser compatibility
    • Forms
    • Links
    • Performance
    • SEO fundamentals
    • Security
    • Analytics
    • Deployment configuration

    The objective is to deliver a website that is ready to become part of the company’s ongoing marketing and sales infrastructure.


    What Makes a Website Worth the Investment?

    A website becomes more valuable when it contributes to the business beyond simply existing online.

    For example, a professional website can become the foundation for:

    SEO → Organic traffic → Content → Leads → CRM → Sales

    It can also become the starting point for:

    Website → Customer portal → Automation → Internal systems → Digital product

    This is why the cheapest website isn’t necessarily the least expensive option, and the most expensive website isn’t necessarily the right option.

    The appropriate investment is the one that matches your business requirements.


    Questions to Ask Before Hiring a Website Development Company

    Before signing a website development contract, ask:

    What exactly is included?

    Clarify:

    • Number of pages
    • Design
    • Development
    • Content
    • SEO
    • Hosting
    • Analytics
    • Integrations
    • Testing
    • Deployment

    Who owns the website?

    Make sure you understand ownership of:

    • Source code
    • Design files
    • Domain
    • Hosting account
    • Content
    • Database
    • Third-party accounts

    Is SEO included?

    Ask whether SEO means only metadata or whether the website architecture is actually designed to support search visibility.

    What happens after launch?

    Understand:

    • Bug-fix period
    • Maintenance
    • Security updates
    • Hosting
    • Support
    • Future development

    Can the website grow with the business?

    A website that works today may need to support substantially more functionality in two or three years.

    Discuss future requirements before choosing the architecture.

    Final Thoughts

    The cost of a professional business website in 2026 can range from a few thousand dollars to tens of thousands of dollars.

    But the price should never be evaluated in isolation.

    A business website can be:

    • A digital brochure
    • A lead-generation engine
    • An SEO platform
    • A sales channel
    • A customer portal
    • Or the foundation of a larger software product

    The right budget depends on what you need the website to accomplish.

    If your business needs more than a template and you want a website designed around your brand, customers, SEO, lead generation and future growth, the first step is to define the requirements and scope before deciding on a technology or budget.

    Building a new business website?

    Tell us what you’re trying to build, what your business needs, and where you want the website to take you. The Drasken Labs team can help you define the scope, technical approach and development requirements for your project.

    Discuss your website project with Drasken Labs →

    How much does a professional business website cost in 2026?

    A professional business website commonly falls somewhere around $2,000–$7,500, while more customized websites can cost $5,000–$15,000 or more. The actual cost depends on design, functionality, content, SEO, integrations and technical requirements.

    How much does a 5-page business website cost?

    A five-page website can cost anywhere from several hundred dollars to several thousand dollars. Page count alone isn’t enough to determine the price because custom design, integrations, content and technical requirements can significantly change the scope.

    Is $1,000 enough for a professional website?

    It can be enough for a relatively simple business website, particularly when using an existing theme or template. A highly customized website with extensive design, SEO, integrations and custom development would generally require a larger budget.

    How much does a custom website cost?

    Custom business websites commonly start around $5,000 and can exceed $15,000, depending on the functionality and engineering requirements.

    How long does it take to build a professional website?

    A relatively straightforward professional website may take several weeks. More complex websites can take several months. The timeline depends on scope, content readiness, design revisions, integrations and development complexity.

    Does website development include SEO?

    It depends on the development company and project scope. Technical SEO should be considered during development, but ongoing SEO generally involves additional content, authority building, technical improvements and continuous optimization.

    Should I choose WordPress or a custom website?

    Neither is universally better.
    WordPress can be appropriate for businesses that need a flexible content management system and a relatively conventional website.
    Custom development can make more sense when the business requires unique functionality, complex integrations, specialized workflows or greater control over the application architecture.
    The choice should follow the business requirements.

    How much does website maintenance cost?

    Maintenance costs vary considerably. A simple website may require only occasional updates, while a custom application may need continuous development, monitoring, security updates and infrastructure management.

  • High Cardinality Metrics: Why Your Observability Bill Grew 4x

    High Cardinality Metrics: Why Your Observability Bill Grew 4x

    High cardinality metrics are the reason, almost every time.

    Traffic grew 30% this year. The observability bill grew 400%. Nobody changed the vendor, nobody added a new tool, and no single person can explain what happened.

    This is one of the most common infrastructure cost surprises we see, and it’s almost always the same cause. Observability platforms do not bill by traffic. They bill by the number of distinct things you ask them to remember. That number is cardinality, and it multiplies rather than adds.

    Once you understand the multiplication, the fix is mechanical.

    What high cardinality metrics actually are

    A metric is not one number. A metric with labels is one number per unique combination of label values, and each of those combinations is a separate time series that has to be stored, indexed, and queried.

    Take a request counter:

    http_requests_total{service, endpoint, method, status}

    With 10 services, 20 endpoints, 4 methods, and 5 status codes, that’s 10 × 20 × 4 × 5 = 4,000 time series. Entirely fine.

    Now someone adds customer_id to help debug a support ticket. You have 5,000 customers.

    4,000 × 5,000 = 20 million time series, from one line of code.

    The traffic didn’t change. The number of requests didn’t change. But your storage, your index size, your query latency, and your bill all changed by three orders of magnitude, and the commit that did it looked completely reasonable in review.

    This is the shape of nearly every observability cost incident: a small, sensible-looking change to a label set.

    The labels that cause it

    Some values are unbounded by nature. Putting any of these in a metric label is how you get the 400% bill.

    • User or customer identifiers. Grows with your business. This is the classic.
    • Request or trace IDs. Unique per request. Every single request creates a new time series that is written once and never queried again.
    • Raw URL paths. /api/users/8f3a2b and /api/users/c91e4d are different label values. Every user ID in a path becomes a series.
    • Email addresses, session tokens, order numbers. Same problem, and often a privacy issue on top.
    • Container, pod, or instance IDs. Subtler and very common. In a Kubernetes environment with rolling deploys, pod names change on every release. Deploy ten times a day and you generate ten new sets of series daily, most of them dead within the hour but still stored, still indexed, still billed.
    • Full error messages. "connection refused to 10.0.4.19:5432" is not a label value. "connection_refused" is.
    • Timestamps. Rare but catastrophic. Every scrape becomes a new series.

    The pod-ID one deserves emphasis because it hides. Nobody deliberately adds it — it arrives by default from a Kubernetes service discovery config or an auto-instrumentation library, and it silently multiplies your entire metric set by your deploy frequency.

    The rule that resolves it

    Metrics, traces, and logs have different cost profiles, and the discipline is to put each dimension where it belongs.

    Metrics are for low-cardinality aggregate questions. How many requests, how many errors, what’s the p99. Bounded labels only: service name, endpoint template, method, status class, environment, region. If a label’s value set could grow without limit, it does not belong on a metric.

    Traces are for high-cardinality specifics. This is the correct home for user IDs, request IDs, order numbers, feature flag states, and full URLs. Span attributes are stored per-span, not as a cross-product, so adding an attribute costs you linearly rather than multiplicatively. The rule of thumb: anything you want to filter one request by belongs on a span; anything you want to graph over time belongs on a metric.

    Logs are for detail, sampled and retained deliberately. Cheap per event, ruinous in aggregate. CloudWatch Logs bills around $0.50 per GB ingested; most vendors are comparable. A service logging every health check at debug level generates a remarkable amount of money’s worth of nothing.

    Almost every cardinality problem we’ve debugged was a high-cardinality dimension that had been put on a metric when it should have been on a span.

    Templating your paths

    The single highest-value fix, and the one most often missed.

    Auto-instrumentation frequently records the raw request path. You want the route template:

    BAD:   http_requests_total{path="/api/users/8f3a2b/orders/119"}
    GOOD:  http_requests_total{route="/api/users/{id}/orders/{order_id}"}

    Most frameworks expose the matched route rather than the raw path — Express, FastAPI, Spring, Rails all do. Use it. The OpenTelemetry semantic conventions specify http.route for exactly this reason, and if your instrumentation is populating http.target into a metric label instead, that’s your bug.

    While you’re there: use the semantic conventions generally. Naming your attributes http.request.method and service.name rather than inventing your own means your dashboards and alerts survive a change of vendor or instrumentation library, which is worth more than it sounds like the day you need it.

    The Collector is your control point

    Instrumenting every service to emit exactly the right data, and keeping it that way as forty developers commit, is not achievable. Put the enforcement somewhere central instead.

    The OpenTelemetry Collector sits between your applications and your backend. Everything passes through it, which makes it the one place you can apply policy without touching application code.

    Drop attributes before they reach the backend. An attributes processor can delete user.id and session.token from metrics while leaving them on spans. One config change, applied to every service.

    Filter what you don’t need. Health check spans, /metrics scrapes, readiness probes. These are pure noise and they’re often a double-digit percentage of your span volume.

    Batch. Reduces network overhead and, with per-request-billing vendors, directly reduces cost.

    Switch backends without redeploying anything. Because your applications speak OTLP to the Collector and only the Collector knows about your vendor, changing vendors is a config change. This is the strongest practical argument for OpenTelemetry over vendor-specific agents, and it’s worth setting up before you need it, not during a contract renegotiation.

    Run it as a DaemonSet for node-local collection, plus a gateway deployment for anything requiring a full view of a trace. That second part matters for the next section.

    Sampling traces properly

    You cannot afford to store every trace at any real volume. The question is which ones you keep.

    Head sampling decides at the start of the request, usually with a fixed probability. Cheap, simple, and stateless — but it decides before knowing whether the request failed or took nine seconds. At 1% head sampling you throw away 99% of your errors, which are the traces you actually wanted.

    Tail sampling buffers complete traces and decides after seeing the outcome. This is what you want:

    • Keep 100% of traces containing an error
    • Keep 100% of traces above a latency threshold
    • Keep 100% of traces for low-traffic endpoints, which would otherwise vanish entirely
    • Keep 1–5% of everything else as a healthy baseline

    The result is that you store a small fraction of your volume while retaining essentially all of the diagnostically interesting traces. Ten to twenty times cost reduction with better debugging is not a typical trade in infrastructure, and it’s available here.

    The catch: tail sampling requires all spans of a trace to reach the same Collector instance. That means a gateway tier with trace-ID-aware load balancing in front of it, and memory sized for your buffering window. It’s a real piece of architecture, not a config flag, but it’s a day’s work and it pays for itself immediately.

    Log discipline

    Three changes cover most of the waste.

    Drop noise at the source. Health checks, readiness probes, and load balancer pings should be filtered at the agent or Collector, not ingested and then ignored. This is frequently 20–40% of log volume in a Kubernetes environment.

    Structure your logs. JSON, with consistent field names, and the trace ID included so you can jump from a log line to the full trace. Unstructured logs force you to pay for full-text indexing to get anything back out.

    Tier your retention. Seven days hot and searchable, ninety days in object storage for compliance, nothing beyond that unless a regulator says otherwise. Setting explicit retention on every log group matters because the default on most platforms is “keep forever,” which is almost never what anyone intended.

    And the recurring one: audit your log levels in production. Debug logging left on after an incident is one of the most common causes of a sudden bill increase we see.

    A quick audit

    Half a day, and it usually finds most of it.

    1. Find your top series by cardinality. On Prometheus, topk(20, count by (__name__)({__name__=~".+"})) shows which metric names generate the most series. On Datadog, the custom metrics breakdown does the same. The offender is usually obvious and usually a single metric.
    2. Check your top ten metrics’ label sets. Any label whose value set could grow unboundedly is a finding.
    3. Grep for raw paths. Search dashboards and metric names for anything containing a UUID or a numeric ID.
    4. Measure health check traffic. As a proportion of total spans and log lines. If it’s over 10%, filter it today.
    5. Confirm your sampling strategy. If you’re head sampling at a low rate, you’re discarding errors. Move to tail sampling.
    6. List log groups with no retention policy. Set one on all of them.

    The point isn’t just the bill

    Cost is the visible symptom. The real damage from cardinality explosion is that queries slow down, dashboards time out, and your team stops using the observability stack during incidents because it’s too slow to be useful mid-outage. Cardinality discipline is a reliability practice that happens to also save money.

    There’s a connection to targets here too. Your SLOs are computed from metrics, so a metric set that’s too expensive to query at speed is a burn-rate alert that fires late. And the same cost-attribution discipline that works on cloud infrastructure spend applies to telemetry: without knowing which service generates which cost, nobody owns reducing it.

    If your observability bill has outgrown its usefulness, that’s the kind of thing our observability engagements start with. Send us the shape of your setup and we’ll tell you where it’s going.

    What is high cardinality in metrics?

    Cardinality is the number of unique time series a metric produces, calculated as the product of all its label value counts. High cardinality means that product is large, usually because a label like user ID or request ID has an unbounded set of values. Cost and query latency scale with it.

    Why did my Datadog or Prometheus bill increase without more traffic?

    Almost always a new label with many possible values added to an existing metric, or auto-instrumentation recording raw URL paths instead of route templates. Both multiply your series count without changing request volume. Check which metric names produce the most series first.

    Where should user IDs go if not in metric labels?

    On span attributes. Traces store attributes per span rather than as a cross-product, so a user ID adds cost linearly rather than multiplicatively, and traces are the right tool for investigating individual requests anyway.

    What is tail sampling and why is it better than head sampling?

    Tail sampling decides whether to keep a trace after seeing the complete result, so you can retain all errors and slow requests while discarding most successful ones. Head sampling decides at the start and therefore discards errors at the same rate as everything else.

    How much can we realistically cut observability costs?

    Teams that have never audited cardinality typically find 40–70%, mostly from dropping unbounded labels, filtering health checks, and moving to tail sampling. Query performance usually improves at the same time.

    Does OpenTelemetry lock us into a vendor?

    No, and that’s largely the point. Applications emit OTLP to a Collector, and only the Collector is configured with your backend. Switching vendors is a Collector config change rather than a re-instrumentation project.

  • Do You Need Kubernetes? An Honest Decision Framework for Growing Teams

    Do You Need Kubernetes? An Honest Decision Framework for Growing Teams

    Do you need Kubernetes? If you are asking, the answer is more often “not yet” than the internet suggests.

    We are a Kubernetes shop. We run production clusters for clients, we do migrations, and a meaningful share of our revenue depends on people deciding they want Kubernetes.

    So take this in the spirit it’s intended: most teams that ask us for Kubernetes do not need it yet.

    That is not a fashionable position for an infrastructure consultancy. It is, however, the honest one, and it’s cheaper for you to hear it now than eighteen months into an unhappy migration. What follows is the framework we actually use when a client asks whether they should move.

    What people think they are buying

    When teams ask for Kubernetes, they are usually asking for a list of things. Rolling deploys with zero downtime. Automatic restart of crashed containers. Horizontal autoscaling. Service discovery. Health checks. Secrets management. Config separated from code.

    Every item on that list is available from ECS Fargate, Google Cloud Run, Azure Container Apps, and several smaller platforms, without a control plane to operate. If that list is your motivation, you have not made an argument for Kubernetes. You have made an argument for containers, which you should absolutely adopt, and which is a much smaller decision.

    The question worth asking is narrower: what does Kubernetes do that the managed alternatives do not?

    What Kubernetes genuinely gives you

    Four things, in our experience, are hard to replicate elsewhere.

    Bin-packing density. Kubernetes schedules many containers onto shared nodes according to declared resource requests. If you run thirty services with wildly different resource profiles, the scheduler will pack them far more efficiently than one-task-per-Fargate-instance. With Karpenter provisioning right-sized nodes on demand, the density gain is real and it compounds. Below roughly ten services, there isn’t enough variety for the scheduler to be clever with.

    Fine-grained scheduling control. Affinity and anti-affinity rules, topology spread constraints, taints and tolerations, priority classes, pod disruption budgets. If you need to guarantee that your three replicas land in three different availability zones, or that batch workloads get evicted before customer-facing ones, Kubernetes gives you the vocabulary. Most platforms give you “run N copies.”

    The operator ecosystem. Databases, message queues, certificate management, secret rotation, service meshes. If your architecture depends on running stateful infrastructure yourself rather than consuming managed services, operators are a genuine advantage.

    Portability, conditionally. Kubernetes manifests move between clouds more easily than ECS task definitions. This matters if you have an actual multi-cloud requirement, a regulatory constraint, or customers who insist on self-hosted deployment. It does not matter if “we might switch clouds someday” is hypothetical, and it usually is. Your managed database, your object storage, and your IAM model are all going to be the hard part of any cloud migration, not your container orchestrator.

    If none of those four describe your situation, the case for Kubernetes is weaker than it looks.

    What it actually costs

    The EKS control plane runs about $0.10 per hour, roughly $73 a month per cluster. If you have production, staging, and development clusters, call it $220 a month. GKE and AKS have comparable or slightly friendlier pricing. That number is not the cost.

    The cost is engineering time, and it recurs.

    Version upgrades. Kubernetes ships a minor release roughly every four months. AWS supports each EKS version for around fourteen months before extended-support charges begin. That means an upgrade cycle two to three times a year, every year, forever, and each one touches the control plane, the node groups, and your add-ons — CNI, CoreDNS, kube-proxy, ingress controller, cert-manager, metrics-server. Deprecated APIs break manifests. This is not hard work, but it is real work that never stops.

    The failure modes are unfamiliar. VPC IP exhaustion because the AWS CNI allocates an IP per pod and your subnets were sized for instances. Pods stuck in Pending because of a resource request nobody tuned. DNS resolution failures under load from CoreDNS being under-replicated. Ingress controller misconfiguration that only shows up under a specific traffic pattern. None of these are exotic. All of them require someone who has seen them before, at 2am.

    Someone has to own it. This is the decisive cost. Kubernetes is not a thing you set up; it is a thing you operate. If you cannot name the person who owns cluster health, upgrades, and the on-call rotation for it, you are not ready — you are about to distribute that responsibility across everyone, which means nobody.

    For a five-engineer team, that ownership can easily consume 15–20% of one person’s time. Price that honestly against whatever you expect to save.

    The framework: do you need Kubernetes yet?

    Score each of these. Be strict with yourself.

    Strong signals you’re ready (2 points each):

    • More than fifteen or twenty distinct deployable services
    • Multiple teams deploying independently, needing isolation from each other
    • Heterogeneous, bursty workloads where bin-packing meaningfully improves utilisation
    • A named platform engineer, or someone whose job explicitly includes infrastructure
    • Existing Kubernetes operating experience on the team, not just certification
    • A genuine portability or self-hosted-delivery requirement from customers
    • Running stateful infrastructure yourself where operators do real work

    Moderate signals (1 point each):

    • Ten to fifteen services with growth clearly continuing
    • Batch and stream workloads alongside request-serving ones
    • Need for sophisticated deployment strategies — canary, traffic splitting, progressive rollout
    • Compliance requirements around workload isolation and network policy

    Counter-signals (subtract 2 each):

    • Fewer than eight services
    • One team, one deploy cadence
    • Steady, predictable traffic
    • No one who can name the last CVE they patched
    • The primary motivation is that a competitor or a conference talk uses it
    • You are currently on-fire with reliability problems

    Roughly how to read it. Six or more, Kubernetes will probably earn its complexity. Three to five, it’s genuinely arguable and depends on your trajectory over the next year. Below three, you will spend more on operating it than you recover, and the honest recommendation is to wait.

    What to do instead, if the answer is “not yet”

    ECS on Fargate. The pragmatic AWS default. Task definitions, service autoscaling, ALB integration, rolling deploys, secrets from Parameter Store or Secrets Manager. No control plane, no node patching, no version treadmill. Per-vCPU pricing is higher than raw EC2, which is exactly the trade you’re making: you pay a premium to not employ someone to manage nodes. For most teams under ten services that is a good trade.

    Cloud Run. If you’re on GCP, this is excellent. Scale to zero, request-based billing, deploy from a container image with almost no configuration. The constraints are real (request timeouts, limited background processing) but for HTTP services it’s hard to beat.

    Plain autoscaling groups behind a load balancer. Unfashionable and still correct for a surprising number of workloads. If you have three services with steady traffic, an ASG with a rolling update policy and a health check does what you need.

    Nomad. Worth knowing about if you want orchestration without the Kubernetes surface area, though the smaller ecosystem is a genuine cost.

    The “we’ll need it eventually” argument

    The most common objection is that adopting later means a painful migration, so you may as well start now.

    This is mostly wrong, and it’s worth understanding why. If you containerise your applications and keep your configuration in environment variables rather than baked into the platform — the Twelve-Factor discipline, essentially — then the move from ECS to Kubernetes is a rewrite of your deployment manifests, not your applications. That is a matter of weeks, not quarters, and by the time you do it you’ll have real production data about what your workloads actually need, which makes the resulting cluster design substantially better than one you’d have guessed at eighteen months earlier.

    What does create a painful migration is coupling your application code to platform-specific behaviour: writing to local disk and expecting persistence, relying on instance metadata, hardcoding service endpoints. Avoid those, and your optionality is preserved cheaply.

    Adopt containers early. Adopt orchestration when the service count justifies it.

    When we say yes

    To be clear about the other side: we migrate teams to Kubernetes regularly, and when the signals are there, it delivers. One ecommerce client came to us with four-hour deployments, no rollback path, and infrastructure spend growing faster than traffic. Kubernetes with GitOps took deployments to eight minutes, eliminated production incidents during rollout, and cut infrastructure costs 40% through better packing and autoscaling — the case study is here.

    That worked because they had the service count, the traffic variability, and the team to justify it. The same migration for a four-service startup would have been an expensive way to make deployments more complicated.

    The actual question to ask

    Not “should we use Kubernetes,” but: what is the simplest platform that meets our reliability, scale, and delivery requirements for the next eighteen months?

    Sometimes the honest answer is Kubernetes. Often it’s ECS with a decent CI/CD pipeline and someone paying attention to cloud costs. The difference between those two answers is worth several hundred thousand rupees a year and a meaningful amount of your team’s attention.

    If you want a second opinion on which side of that line you’re on, tell us what you’re running. We’ll give you a straight answer, including when the answer is that you don’t need us yet. That framing is the substance of most of our cloud and DevOps work and our platform engineering engagements.

    Is Kubernetes overkill for a startup?

    Usually, until you’re running somewhere north of ten to fifteen services or have multiple teams deploying independently. Below that, managed container platforms deliver the same practical benefits without the operational overhead of a cluster.

    What’s the real cost of running Kubernetes?

    The control plane is roughly $73 a month per cluster on EKS. The meaningful cost is engineering time: version upgrades two to three times a year, add-on maintenance, and someone owning cluster health. Budget 15–20% of an engineer for a small production setup.

    Is ECS Fargate cheaper than EKS?

    Per unit of compute, Fargate is more expensive than EC2 nodes under EKS. Total cost of ownership frequently favours Fargate for smaller teams, because you’re not paying an engineer to manage nodes and upgrades. The crossover point depends on scale and on whether you already have Kubernetes expertise.

    Can we migrate to Kubernetes later without a rewrite?

    Yes, if your applications are containerised and configured through environment variables rather than platform-specific mechanisms. The migration is then mostly a rewrite of deployment manifests. Coupling application code to platform behaviour is what makes later migration expensive.

    How long does a Kubernetes migration take?

    For a containerised application estate of moderate size, typically six to twelve weeks including cluster design, GitOps setup, staged workload migration, and runbook handover. The applications are rarely the hard part; networking, secrets, and stateful services usually are.

  • Cloud Cost Optimization for Indian Startups: A 7-Day Audit That Usually Finds 30–40%

    Cloud Cost Optimization for Indian Startups: A 7-Day Audit That Usually Finds 30–40%

    Every founder we talk to has the same story about their cloud bill. It was fine, then it wasn’t, and nobody can point at the exact month it stopped being fine.

    Cloud cost optimization gets treated as a finance problem when the invoice arrives. It’s an engineering problem that started months earlier. The industry number is that companies waste roughly a third of their cloud spend. The industry number is that companies waste roughly a third of their cloud spend. That figure gets repeated so often it has stopped meaning anything, so here it is in rupees instead. A Series A SaaS company running ₹8,00,000 a month on AWS is probably burning ₹2,40,000 to ₹3,20,000 of that on infrastructure nobody uses, nobody monitors, and nobody would miss. Over a year that is close to ₹35,00,000. That is two senior engineers, or eighteen months of runway extension, sitting inside a billing console.

    The uncomfortable part is that this is almost never an engineering skill problem. It is a sequencing problem. Infrastructure gets provisioned during a launch crunch, when the only thing that matters is that the thing works. Nobody comes back. The bill compounds quietly, and by the time someone notices, the architecture has grown around the waste and touching it feels risky.

    What follows is the audit we actually run at the start of a cloud and DevOps engagement. It is ordered deliberately. Most cost optimization guides start with Reserved Instances and Savings Plans, which is exactly backwards. Commitment discounts are the last step, not the first, and we will get to why.

    Day 1: Get visibility before you touch anything

    You cannot optimize what you cannot attribute. Before any changes, you need to be able to answer one question: which team, service, or environment is responsible for each line on the bill?

    On AWS, enable Cost Explorer if it isn’t already on. Expect a 24-hour delay before data populates on first activation, so do this before anything else. Then enable Cost and Usage Reports (CUR) delivered to S3, and query them with Athena. Cost Explorer is fine for eyeballing trends; CUR is where you find the truth.

    On GCP, set up billing export to BigQuery. On Azure, use Cost Management exports.

    Then the part everyone skips: tagging. Without cost allocation tags, your bill is one large undifferentiated number. Define a minimal, enforced tag schema, four or five keys at most:

    • env (prod / staging / dev)
    • service (the application or team that owns it)
    • owner (an actual human or team, not “platform”)
    • cost-center (if finance needs it)

    Enforce it in Terraform with default_tags at the provider level, so new resources cannot be created untagged. Retroactive tagging is a slog, but a one-time slog. Untagged resources are where money hides.

    Set your baseline here: total spend for the last three months, grouped by service. Take a screenshot. You will want it later when someone asks what the work achieved.

    Day 2: Delete the zombies

    This is the highest-return, lowest-risk day of the audit, and it usually pays for the whole exercise.

    Zombie resources are things that are running, billing, and attached to nothing. Common ones:

    • Unattached EBS volumes. Instances get terminated; volumes often survive them. You are paying full price for disks nobody can read.
    • Old EBS snapshots. Snapshot on every deploy with no lifecycle policy, and after two years you have thousands.
    • Idle load balancers. An ALB with zero healthy targets still bills the hourly charge.
    • Unassociated Elastic IPs. Worth flagging specifically: since February 2024, AWS charges for all public IPv4 addresses, not just idle ones, at roughly $0.005 per hour each. That is about ₹300 per address per month. Across a sprawling account with hundreds of addresses, this became a real line item overnight and most teams never adjusted.
    • Orphaned NAT Gateways. More on these tomorrow, because they deserve their own conversation.
    • Stopped instances with attached storage. The compute is free; the disk is not.
    • Abandoned dev environments. Someone spun up a full staging stack for a demo in 2024. It is still there.

    Run through Trusted Advisor’s cost optimization checks as a starting point, but do not stop there. Trusted Advisor is conservative and misses a lot.

    Nothing on this list should require an architecture discussion. If a resource is genuinely orphaned, delete it. Take a snapshot first if you’re nervous, then set a calendar reminder to delete the snapshot in 30 days.

    Day 3: Right-size compute, and question the instance family

    Right-sizing has a bad reputation because people do it badly: they look at average CPU, see 12%, and halve the instance. Then something falls over during a traffic spike and the whole exercise gets abandoned.

    Do it properly. Look at p95 and p99 utilization over at least 30 days, not averages, and look at memory alongside CPU. Many workloads that look CPU-idle are memory-constrained, and downsizing them is how you cause an incident.

    Two changes usually deliver more than raw downsizing:

    Move to ARM. On AWS, Graviton instances offer roughly 20% better price-performance than equivalent x86 for most standard workloads. If you are running containerized Node, Python, Go, or JVM services, the migration is often just a multi-architecture image build. GCP has Tau/Axion; Azure has Cobalt. This is one of the few optimizations where you get a discount for doing nothing to your architecture.

    Move gp2 volumes to gp3. gp3 is around 20% cheaper per GB and decouples IOPS from volume size, giving you 3,000 baseline IOPS regardless. On gp2, teams routinely over-provision disk size purely to buy IOPS. This is a live migration on most volume types, and it is close to free money.

    Day 4: The network bill nobody reads

    Data transfer is the single most under-audited line on a cloud bill, because it is invisible in architecture diagrams. Three patterns account for most of it.

    NAT Gateway processing charges. A NAT Gateway costs roughly $0.045 per hour to run plus $0.045 per GB processed. That per-GB charge is the problem. If your private-subnet services pull container images, hit S3, or talk to DynamoDB, every byte goes through NAT and gets billed. We have seen NAT processing exceed the compute cost of the services behind it.

    The fix is usually VPC Gateway Endpoints for S3 and DynamoDB, which cost nothing and route that traffic off the NAT path entirely. This is often a single-digit-hour change that removes a five-figure annual cost. Interface Endpoints (PrivateLink) for other services do have an hourly charge, so those need a genuine per-service calculation, not a blanket rollout.

    Cross-AZ traffic. AWS bills roughly $0.01 per GB in each direction for traffic between availability zones, so ₹ per GB round-trip. Chatty microservices spread randomly across three AZs, or an application layer talking to a database replica in another AZ, generate this constantly. Topology-aware routing in Kubernetes and AZ-aware service placement fix most of it. Note the tension: you are trading some cost against availability, so this is an architecture decision, not a cleanup task.

    Egress to the internet. Serve static assets and media through a CDN rather than directly from origin. Cloudflare and CloudFront both change the economics substantially at volume.

    Day 5: Storage tiers and the CloudWatch Logs surprise

    Storage feels cheap per GB, which is exactly why it grows unchecked.

    Object storage lifecycle policies. S3 Standard to Infrequent Access to Glacier, based on actual access patterns. S3 Intelligent-Tiering handles this automatically and is a good default for large objects, but read the fine print: it charges a small monitoring fee per object per month. For a bucket with tens of millions of tiny files, that monitoring fee can exceed the savings. Intelligent-Tiering suits fewer, larger objects.

    Log retention. This is the one that surprises people. CloudWatch Logs bills around $0.50 per GB ingested, before storage. A verbose debug logger left on in production, or an application logging every health check, can quietly become one of your top five line items. Audit what you are actually ingesting, drop health-check and heartbeat noise at the agent, and set explicit retention on every log group. New log groups default to “never expire,” which is almost never what you want.

    If you are running a proper observability stack, this is also where you decide what belongs in metrics versus logs. Most of what teams log should have been a counter.

    Day 6: Non-production environments are running 24/7 for no reason

    There are 168 hours in a week. Your development and staging environments are genuinely needed for perhaps 50 of them.

    Scheduled shutdown of non-production environments outside working hours is a 60–70% reduction on that portion of the bill, and it is one of the least controversial changes you can make. Instance Scheduler on AWS, or a scheduled GitHub Action calling Terraform, both work. For Kubernetes, scale non-prod node groups to zero overnight.

    Two things make this stick:

    • Make it default-off, opt-in-on. An engineer who needs staging at 11pm can start it with one command. If the default is “always running,” nobody turns it off.
    • Use Spot for non-production. Interruption is annoying in prod and irrelevant in staging. Spot pricing runs 60–90% below on-demand. For CI runners, batch jobs, and stateless dev workloads, there is no good reason not to.

    Day 7: Now buy commitments

    Only now, after six days of removing waste, should you look at Savings Plans and Reserved Instances.

    The reason for the ordering is straightforward. A commitment locks in one or three years of spend at a discount. If you commit before cleaning up, you lock in your waste at a discount, and you have made it harder to remove later, because your committed spend floor now depends on running resources you no longer need.

    Once your baseline is honest:

    • Compute Savings Plans are the flexible option, covering EC2, Fargate, and Lambda across instance families and regions. Lower discount than a strict RI, far lower regret risk.
    • Start conservative. Commit to your reliable floor, roughly your minimum sustained usage, not your average. Savings Plans stack, so you can add more later. You cannot easily unwind an over-commitment.
    • One year, no upfront is the sensible default for a startup whose architecture will change. Three-year all-upfront gets you the headline discount rates, but only makes sense if you are genuinely confident about your compute shape three years out. Most Series A companies are not.
    • Check India-specific billing. If you are invoiced through AWS India (AISPL) in INR, your GST treatment and credit application differ from a direct AWS Inc account. Worth a conversation with your finance team before committing, since it affects the real post-tax saving.

    The Kubernetes question

    Somewhere in this process, someone will suggest that Kubernetes will fix the cost problem. Sometimes that is right. Often it is not.

    Kubernetes improves bin-packing, and with Karpenter or Cluster Autoscaler it genuinely reduces waste on workloads with variable, bursty demand across many services. If you are running twenty-plus services with uneven load, it earns its place.

    If you are running four services on six instances, Kubernetes adds a control plane charge, a meaningful operational burden, and a new category of things that can page you at 3am, in exchange for savings you could have gotten from right-sizing. ECS Fargate, Cloud Run, or plain autoscaling groups are frequently the cheaper total-cost answer once you price in engineering time.

    Our position on this is unchanged: use Kubernetes when it earns its complexity, not before. The same applies to service meshes, multi-region active-active, and most of the rest of the cloud-native catalogue. If you want a longer conversation about where that line sits for your architecture, that is the substance of most of our platform engineering work.

    Making cloud cost optimization stick

    The failure mode of every cost optimization project is that the bill drops 35% in month one and climbs back over the following year. Cleanup is a project; cost discipline is a system. Three guardrails do most of the work:

    1. Budgets and anomaly detection. Set a monthly budget with alerts at 50%, 80%, and 100%. Enable cost anomaly detection so a runaway resource surfaces in days, not at the end of the billing cycle.
    2. Tag enforcement in code. Untagged resources should fail the pipeline, not get cleaned up in a quarterly sweep. Enforce it in Terraform and in policy checks.
    3. Cost as a review item. A ten-minute monthly review of the top five line items, owned by a named person, catches almost everything. Cost regressions behave like performance regressions: cheap to catch early, expensive to catch late.

    Add cost visibility to the same dashboards your team already looks at. Spend that is only visible in a billing console nobody opens is spend that will drift.

    What a cloud cost optimization engagement looks like

    For most teams, this is a two-to-three week piece of work: a week of audit and quick wins, then a week or two implementing the changes that need testing. The zombie cleanup and network fixes usually deliver the majority of the savings, and they carry the least risk.

    We have run this on production systems where the outcome was a 40% infrastructure cost reduction with zero production incidents during the migration, alongside the GitOps and delivery work described in this case study. Cost optimization is part of how we build, not a separate upsell.

    If your cloud bill has stopped making sense, tell us what you’re running. You will hear back from a senior engineer within one business day with an actual assessment, not a discovery call.

    How much can we realistically save on cloud costs?

    For a team that has never run a structured audit, 25–40% is a normal outcome, and most of it comes from removing genuinely unused resources rather than from clever architecture. Teams that already practise FinOps typically find 5–15%.

    Will optimizing cloud costs make our system less reliable?

    The first two-thirds of this audit removes resources that serve no traffic, which carries no reliability cost. Risk enters at right-sizing and cross-AZ consolidation, which is why those changes need utilization data and staged rollout rather than a spreadsheet.

    Should we move off the cloud to reduce costs?

    Rarely, and almost never at startup scale. Repatriation makes sense for large, stable, predictable workloads where the hardware pays for itself. If your bill is growing because of waste rather than scale, moving that waste to your own servers does not fix it.

    How long does a cloud cost audit take?

    The assessment itself takes about a week once billing data access is in place. Implementation depends on how much needs testing, but most teams see the first savings land within two weeks.

    Do we need Kubernetes to optimize cloud costs?

    No. Kubernetes helps with bin-packing at scale, but for smaller service counts it usually adds more operational cost than it saves. Right-sizing, scheduling, and network fixes deliver more for most teams.